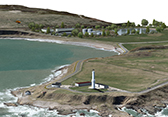
Marine and Seascape Visualization
Pressures for change in coastal areas creates a demand for raising the awareness of public and professional audiences of potential impacts on the environment and communities, Visualizations help to communicate the nature of changes which might be expected, and enable virtual tours and views of new land and seascapes not otherwise possible.
Wind and tidal turbines in a virtual fly-through. Reflections, waves, sea-states, atmospheric conditions and turbine movement are animated. 
Aquaculture and wind turbines: Round fish farms - view from ocean surface.
Square Fish Farms. View from underwater. 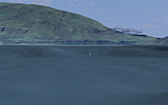
Sea floor, showing moraines and 'gas generated holes': View from underwater. 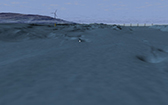
Tidal turbines: View from underwater. 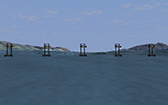
Land and sea bed showing U-shaped valleys and moraines 
Firth of Lorn: Seabed data supplied by the Scottish Association for Marine Science, overlayed with Ordnance Survey terrain data. 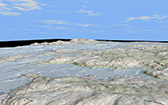
Nigg Bay and Girdleness lighthouse, Aberdeen. Visualization tools were used in planning a coastal footpath and landscaping of sewerage treatment plant.


