


Greenspace Data
Data sources
European Environment Agency (EEA), produced the Urban Atlas. This represents land cover or land use data for 305 large urban zones and their surroundings (of greater than 100,000 inhabitants). The date of the data is c.2006. Data can be downloaded in ESRI shapefile format, as well as formatted maps in *.pdf documents. For Scotland, data are provided for Edinburgh, Glasgow and Aberdeen.
The Open Street Map provides free access to topographic data, available for most countries in the world. This dataset is compiled by volunteers, supported by some public agencies, using GPS and aerial photography. It is compiled using common mapping standards irrespective of country, thus providing datasets which are consistent across national boundaries. The data comprises land cover and uses (i.e. polygons), and linear and point features. Land cover and use includes classes for green and open spaces, and water bodies. Data can be downloaded for any area of the world for use in Geographic Information Systems in formats such as ESRI shapefiles.
Land cover and land use: Scotland
There is no statutory body with responsibility for mapping land cover or land use in Great Britain. Mapping land cover or use have been in three broad categories:
(i) Responsibilities for land use sectors such as forestry or agriculture
 Woodland: The National Woodland Inventory provides maps, reports and spatial data for Scotland, England, Wales, and in combination, for Great Britain. These data are based on interpretation of Ordnance Survey colour 25 cm orthorectified digital imagery (between 2000 and 2009), and boundaries using OS MasterMap, with a minimum mapping unit of 0.5 ha. Urban and rural woodland is included in the dataset. The total area of woodland in Scotland is 1,383 km2. A map of woodland for Scotland is available from the Forestry Commission.
Spatial data of woodlands can be downloaded from the Forest Commission.
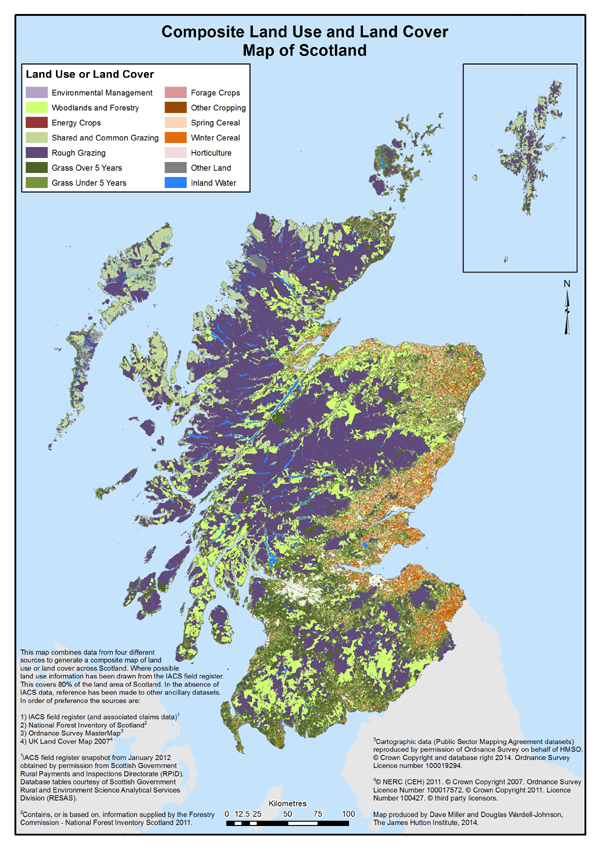
Agriculture: Agricultural land parcels are recorded as part of the Integrated Administration and Control System (IACS).
This system is part of the administration of agricultural support systems under the Common Agricultural Policy (CAP). These data have been analysed and used to produce a map of agricultural land uses for Scotland by the James Hutton Institute. updated each year.
(ii) Mapping with a primary focus on natural heritage habitats
The land cover of Great Britain has been mapped for 1990, 2000 and 2007 by the Centre for Ecology and Hydrology (CEH). Digital data for each of the following datasets can be requested from CEH.
LCGB 1990 was based on classification of satellite imagery, at a spatial resolution of 25 m, with 25 land cover classes, The classification includes woodland, and suburban/rural development. The latter includes land recorded as a mixture of built-up land and permanent vegetation.
LCGB 2000 was based on classification of satellite imagery, with 26 land cover classes. The classification includes woodlands, continuous urban, and sub-urban and rural developed (which includes built up areas and gardens).
LCGB 2007 is parcel-based classification of UK land cover, based on classification of satellite imagery and OS MasterMap, with 23 land cover classes and a spatial resolution of 25 to 30 m. It has a minimum mapping unit of 0.5 ha. It has one broad habitat class of Built-up areas and gardens, from the LCM2007 urban and suburban classes.
Land Cover of Scotland 1988 is an aerial photographic interpretation of land cover, at a scale of 1:25,000, for aerial photography between 1986 and 1993. The classification includes woodland types, urban and developed rural areas.
(iii) Land utilisation surveys
Two land utilisation surveys were undertaken for urban and rural land by Dudley Stamp (1930s) and Alice Coleman (1960s). Both datasets were mapped by volunteers.
- The first survey was mapped at 1:10,560, published on an Ordnance Survey backdrop at 1:63,360, by 1948 (Stamp 1948). Classes included gardens, orchards and nurseries, built up areas, cemeteries, transport, and various types of water feature. This is comprehensively described at the 'Land of Britain' WWW site.
- The second survey was mapped at 1:25,000. The classification comprises 64 classes, which included a class for parks and open spaces, as well as settlements, industry and transport.
Land cover change
Mapping or measurement has also been used for the purpose of calculating changes in cover, generally based on a sampling strategy. An example for Scotland is the National Countryside Monitoring Scheme, by Scottish Natural Heritage and predecessor organisations, mapped 7.5% of the land area of Scotland for three time periods (1940s to late 1980s), but focused on land outwith the urban areas of Scotland, and reported by 12 Region across Scotland. A summary of findings are published in Bell et al., (1997).
National topographic mapping is undertaken by Ordnance Survey. This is a comprehensive spatial database of Great Britain, with features representing land cover and use as polygons, lines and points. It is continually updated, with unique codes for every building and land feature. Topographic areas are coded to represent natural environment areas. A detailed description is provided in the Technical Specification.
Urban land use and land cover: Scotland
Scotland's Greenspace map is a dataset provided through a web mapping service which enables interactive inspection of data at different scales for all of Scotland. It is managed by greenspace scotland. It was compiled from data provided by each Scottish local authority following agreed mapping protocols and the classification used is based on that of the Scottish Executive Planning Advice Note: PAN 65 Planning and Open Space. It comprises 23 open space types, details of which can be found here.
For the GreenHealth project several spatial datasets were used according to objective.
The Ordnance Survey MasterMap Topographic Layer was used a basis for calculating the extent and proportions of greenspace for different geographies. These data were published in 2008, and combined to produce a Scotland-wide dataset, by local authority. A classification was based on that of the PAN 65 typology, and estimates derived of land cover / use. These were summarised by local authority, Intermediate Datazone, Post Code and CAS ward. These summaries were tested for associations with human health and wellbeing, reported in scientific papers (e.g. Roe et al., 2013; Ward Thompson et al., 2012).
For some greenspaces, the 'housing catchment was derived for selected distances of the shortest walking route.
Changes in urban land use, and green and open space in particular, have been calculated using OS MasterMap data for 2015 and 2008. Summary tables of such change have been produced for selected local authority areas.
References
- Bell, SL, Matthews, JR, Banham, A and Harding, T (1997) National Countryside Monitoring Scheme: ecological interpretation and environmental audit report. Scottish Natural Heritage Research, Survey and Monitoring Report No. 98.
- Roe, J., Ward Thompson, C., Aspinall, P.A., Brewer, M.J., Duff, E., Miller, D., Mitchell, R., Clow, A. 2013. Green Space and Stress: Evidence from Cortisol Measures in Deprived Urban Communities. International Journal of Environmental Research and Public Health 10(9), 4086-4103.
- Stamp, L.D. (1948),The Land of Britain: Its Use and Misuse. London: Longmans, Green and Co.
- Ward Thompson, C., Roe, J., Aspinall, P., Mitchell, R., Clow, A. and Miller, D.R. 2012. More green space is linked to less stress in deprived communities: evidence from salivary cortisol patterns. Landscape and Urban Planning 105, 221-229.
