Gillian Donaldson-Selby
Gillian has a Masters in Environment and Development from the Centre for Environment, Agriculture and Development, University of KwaZulu-Natal, Pietermaritzburg, South Africa. Following graduation she worked as a Landscape modeller / Environmental consultant in South Africa until joining the Institute in December 2009. Gillian has worked with a number of 3D modelling, GIS and visualization systems on different computing platforms since the early 1990’s. Her current responsibilities include Landscape and Marine model development [2], project research, and Virtual Landscape Theatre [3](VLT) operation and presentation. Some of her 3D interactive models for the VLT can be seen here [4].
Current research interests
 [5]
[5]
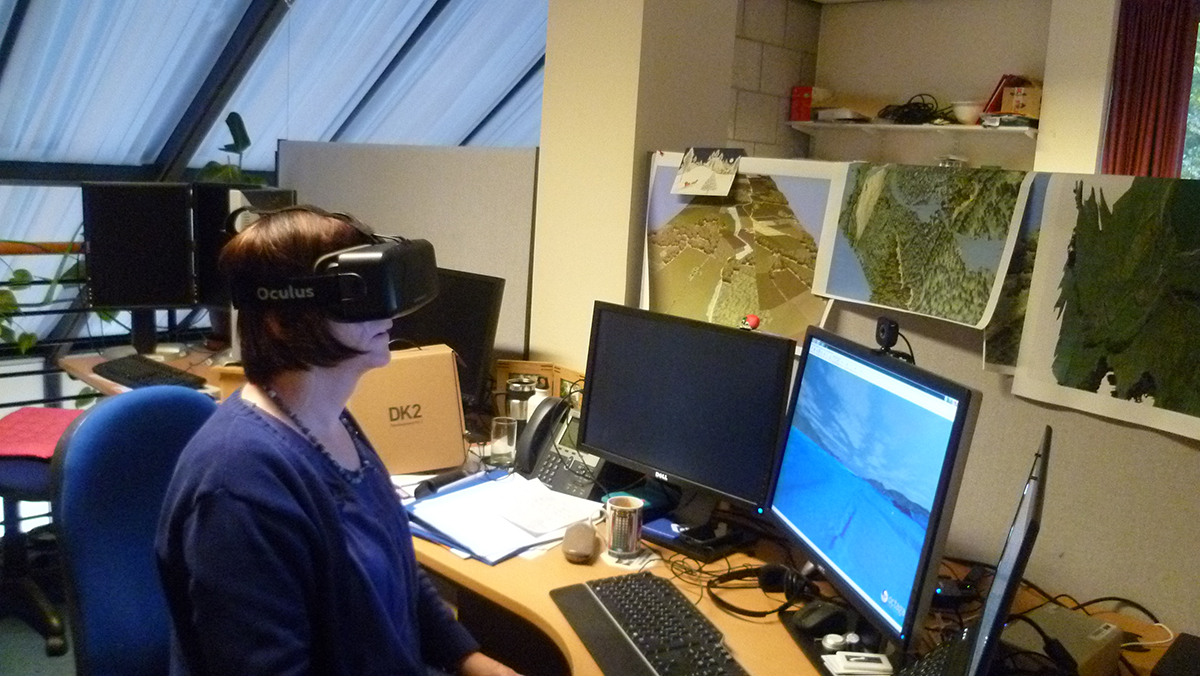
Gillian’s past and current research interests have largely focused on the application of landscape visualization in public participation and environmental problem solving, including landscapes, river rehabilitation, peatlands, natural flood managment (NFM) and onshore / offshore renewables. Some of Gillian's landscape visualizations have been used in urban greening exercises in South Africa, as well as Scottish government sponsored RESAS work packages and Green Health projects in Scotland. Recently she has been involved in 3D visualizations of marine topologies, onshore / offshore renewables [6], peatland restoration, aquaculture and flood risk mapping. She is also interested in promoting the application and take-up of scientific visualization within the broader scientific community, including high-performance Virtual Reality (VR) systems (e.g. Oculus Rift [7]) and immersive stereoscopic CAVEs. Gillian is currently registered for a part-time PhD in Peatland Hydrology.
Past research
Visualizations from a few of her past projects are listed below.
Visualising Peatland Restoration
We have developed a prototype 3D simulation of the Forsinard peatlands which visually illustrates the progress of restoration in different areas of the RSPB Forsinard reserve. The aim of the visualisation is to show the [8] viewer a chronosequence of the peatland restoration process and the underlying management, current knowledge and research. The visualisations allow the viewer to dynamically fly through the peatland, switch scenarios showing past, present and (near) future states, while allowing the viewer to experience and examine the peatlands in an immersive environment. We are also currently exploring the usefulness of the visualisations in predicting the trajectory and timelines of restoration efforts. A simplified version of the model, using the same software, was also generated for use with Oculus Rift VR headsets.
A prototype of the simulation was demonstrated on laptop and VR headset at the Research in the ‘Flow Country’: Thinking Big Conference, Thurso, 21-23 March, 2017. The model  [9]attracted interest from stakeholders including RSPB and SNH. A complete version was demonstrated on a touch table at the Royal Highland Show 22-25 June, 2017. This model attracted considerable interest from stakeholders and community members familiar with, or resident in, the area. The VR model was also demonstrated at the Scottish Game Fair 30 June – 2 July, 2017.
 [10] Visualising Marine Renewables.
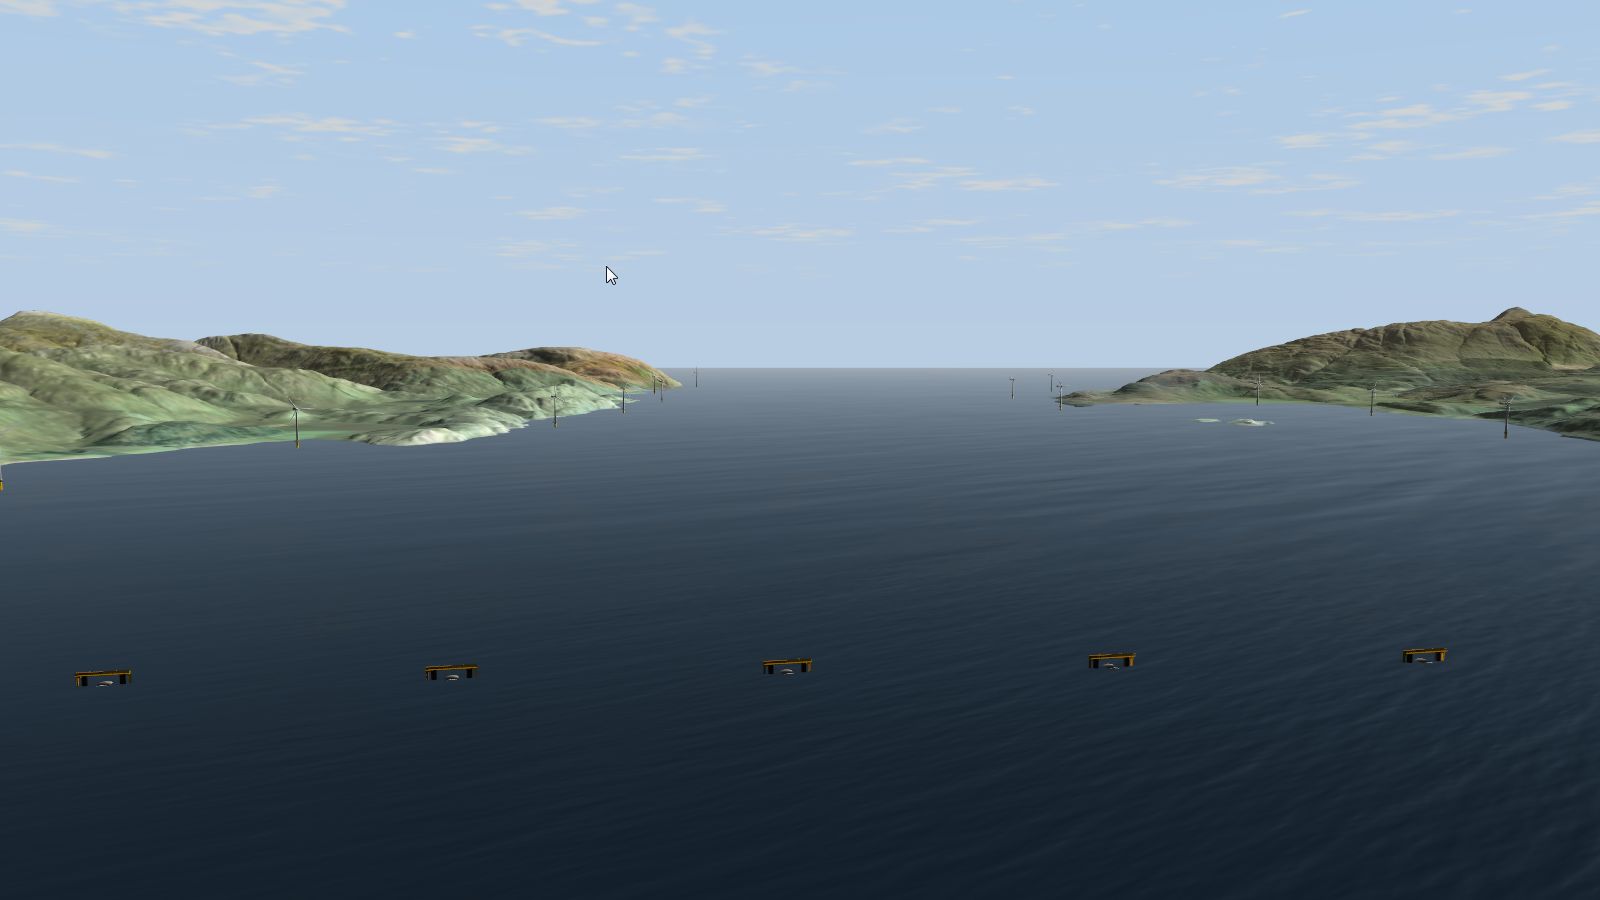
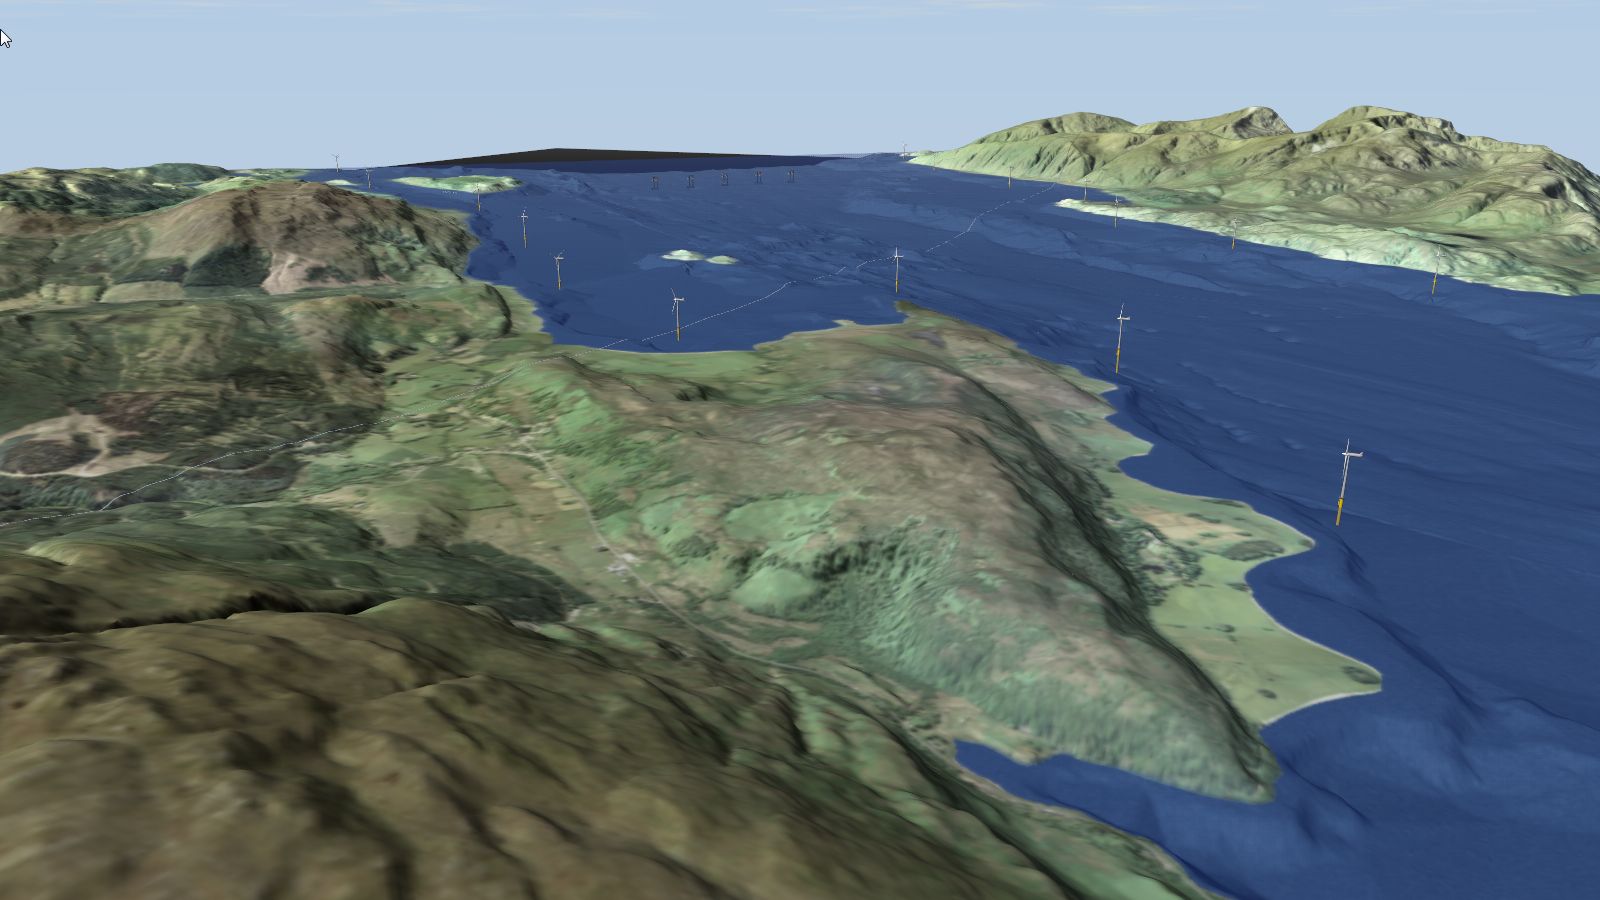
Visualization of an offshore wind farm and tidal turbine array. The visualization has attempted to capture water [11] and land [12] detail at a high a level of realism. The turbines and waves are animated [13] in the model.
Visualization of sea bed and land terrain
 [14]Visualization of Loch Linnhe showing terrain and sea bed data (Ordnance Survey / Scottish Association for Marine Science [15]). The model shows glacial erosion on both land and sea, including morraines. The model was presented to council planners, Marine Scotland and SNH staff and the public at the 2012 Festival of the Sea [16], Oban.
 [17] Visualising Natural Flood Management
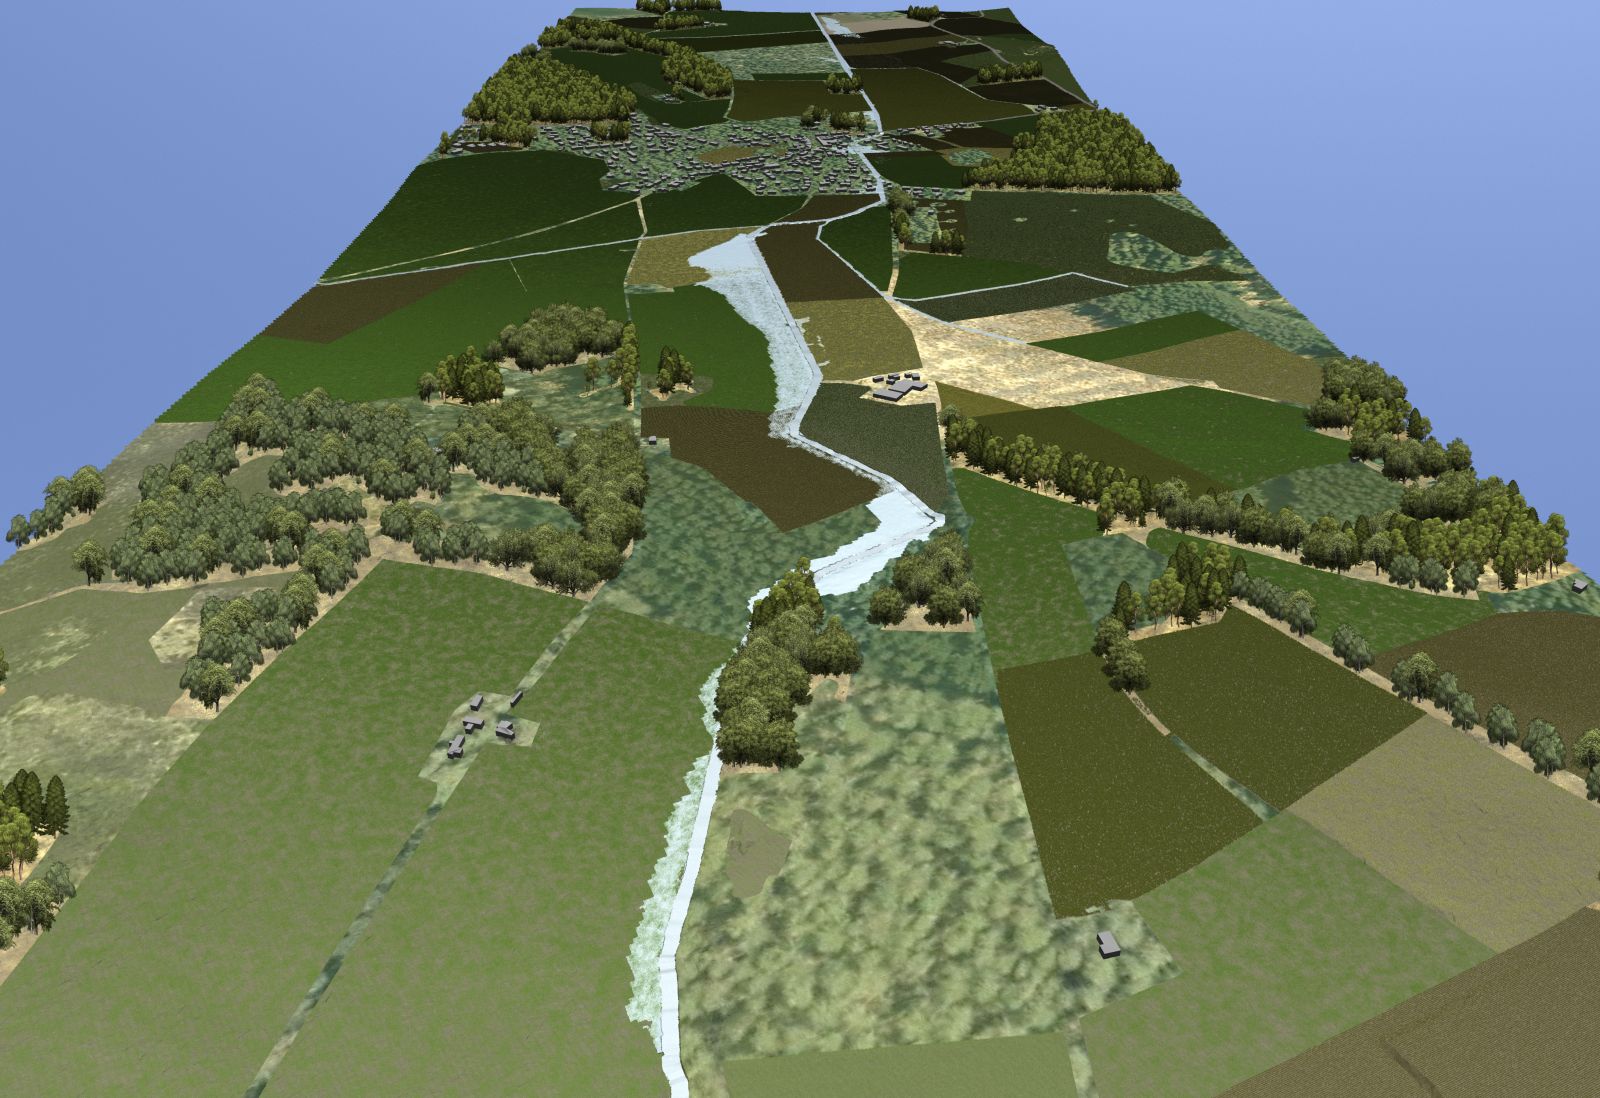
Simulating natural flood management [18] in the Tarland catchment utilising hydrological data from different land use scenarios. The model incorporates various overlays including modern and old (1860’s) Ordnance Survey maps, hypsographic, watershed and land ownership data.
 [19] Visualization of a proposed flood storage detention pond showing the bunding and excavation required (Indicated by the red vector).
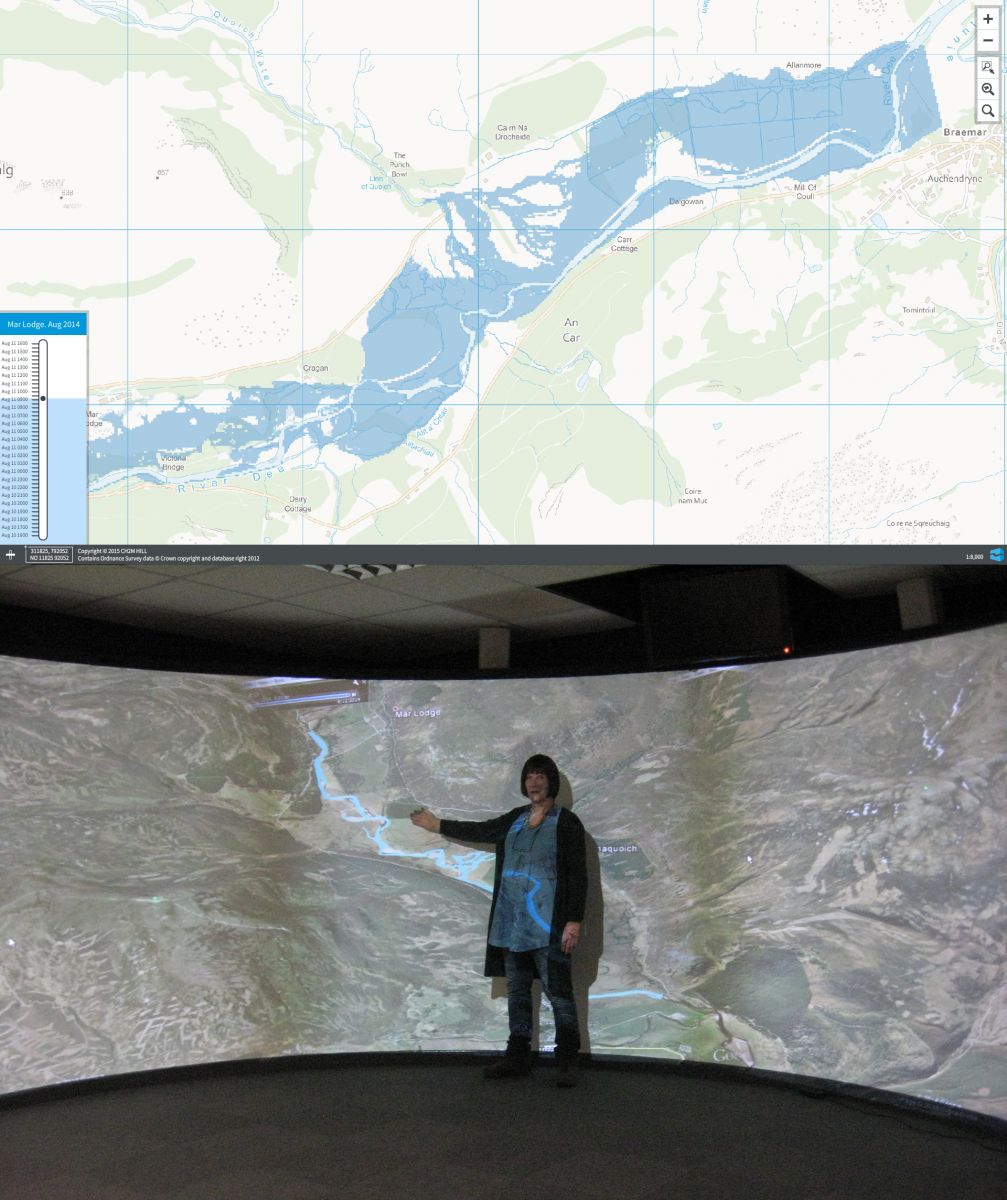 [20] 1D / 2D linked flood model [21] of a flood event at Mar Lodge, Braemar, August 2014, modelled in Flood Modeller [22]. An animated Google Earth model of the same event can be downloaded [23]here [23], as well as a short background report [24] on the model. You can view a short video clip [25] of the Google Earth model here.
Tarland Land Use Scenarios
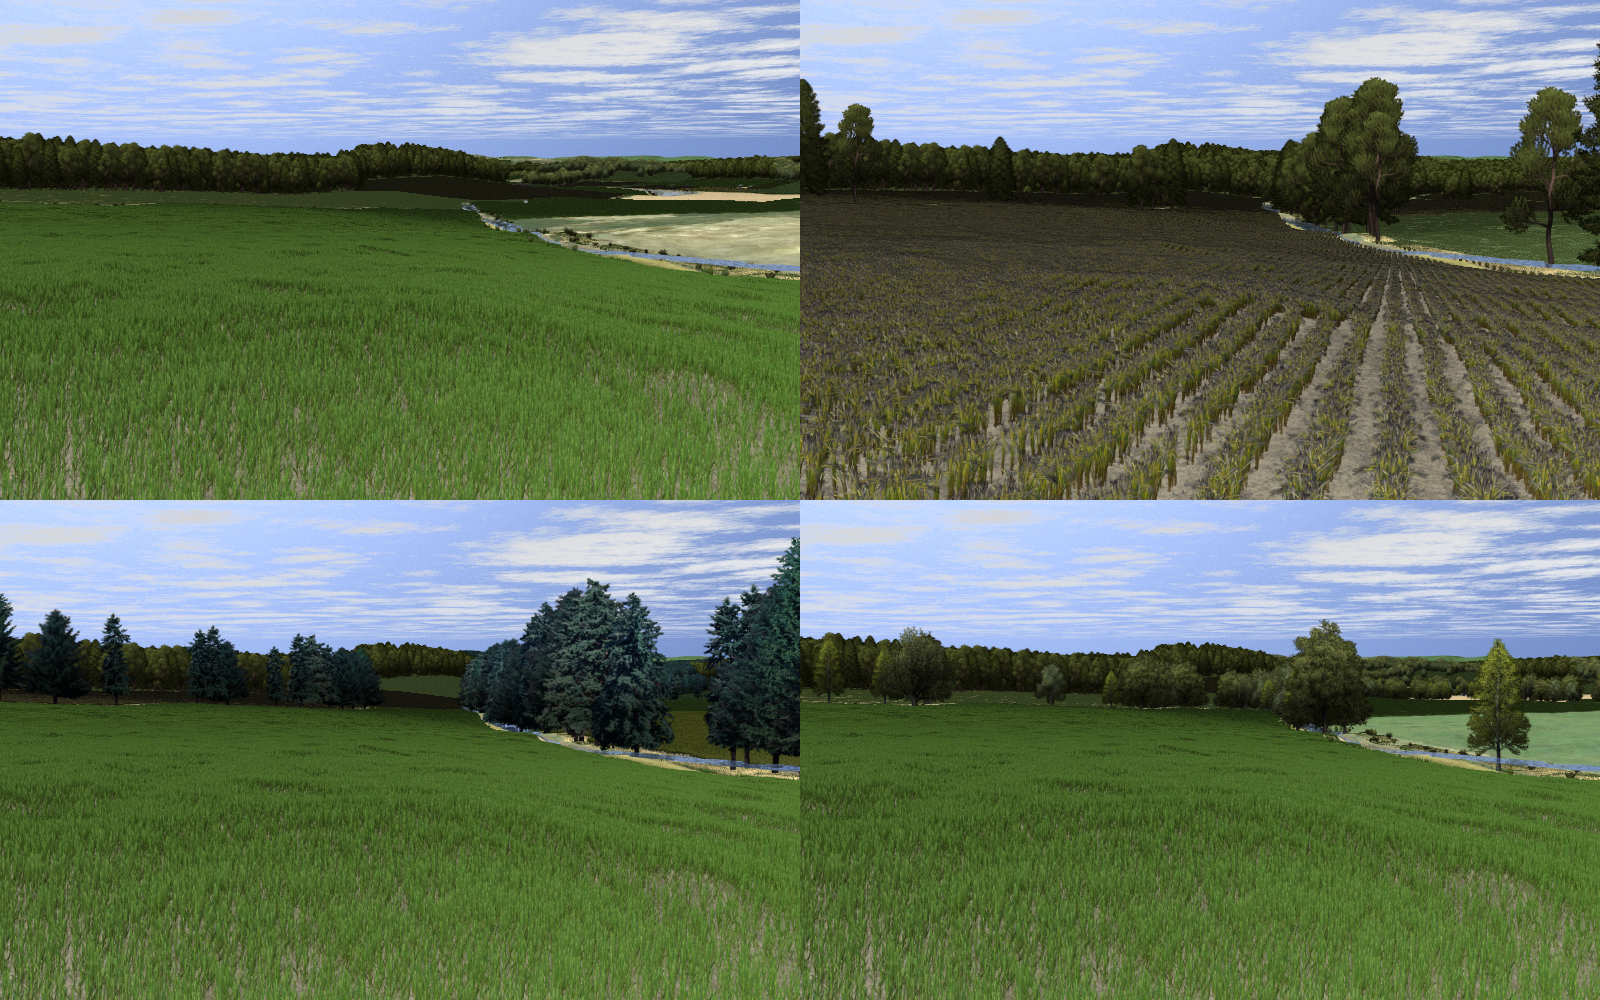 [26] A multi-scenario model incorporating economic, environmental and climate driven land use changes, which has been tested for use with different types of audiences for research, consultation and dissemination. Data have been gathered, through the VLT and an on-line survey, [27] from stakeholder and public audiences relating to perspectives on different landscape scenarios and for the development of land use options from audiences familiar and unfamiliar with the area. The results were reported in a conference paper at the Geographical Information Systems Research – UK (GISRUK) 2012 Conference, University of Lancaster.
 [28] Cultural Ecosystem Services
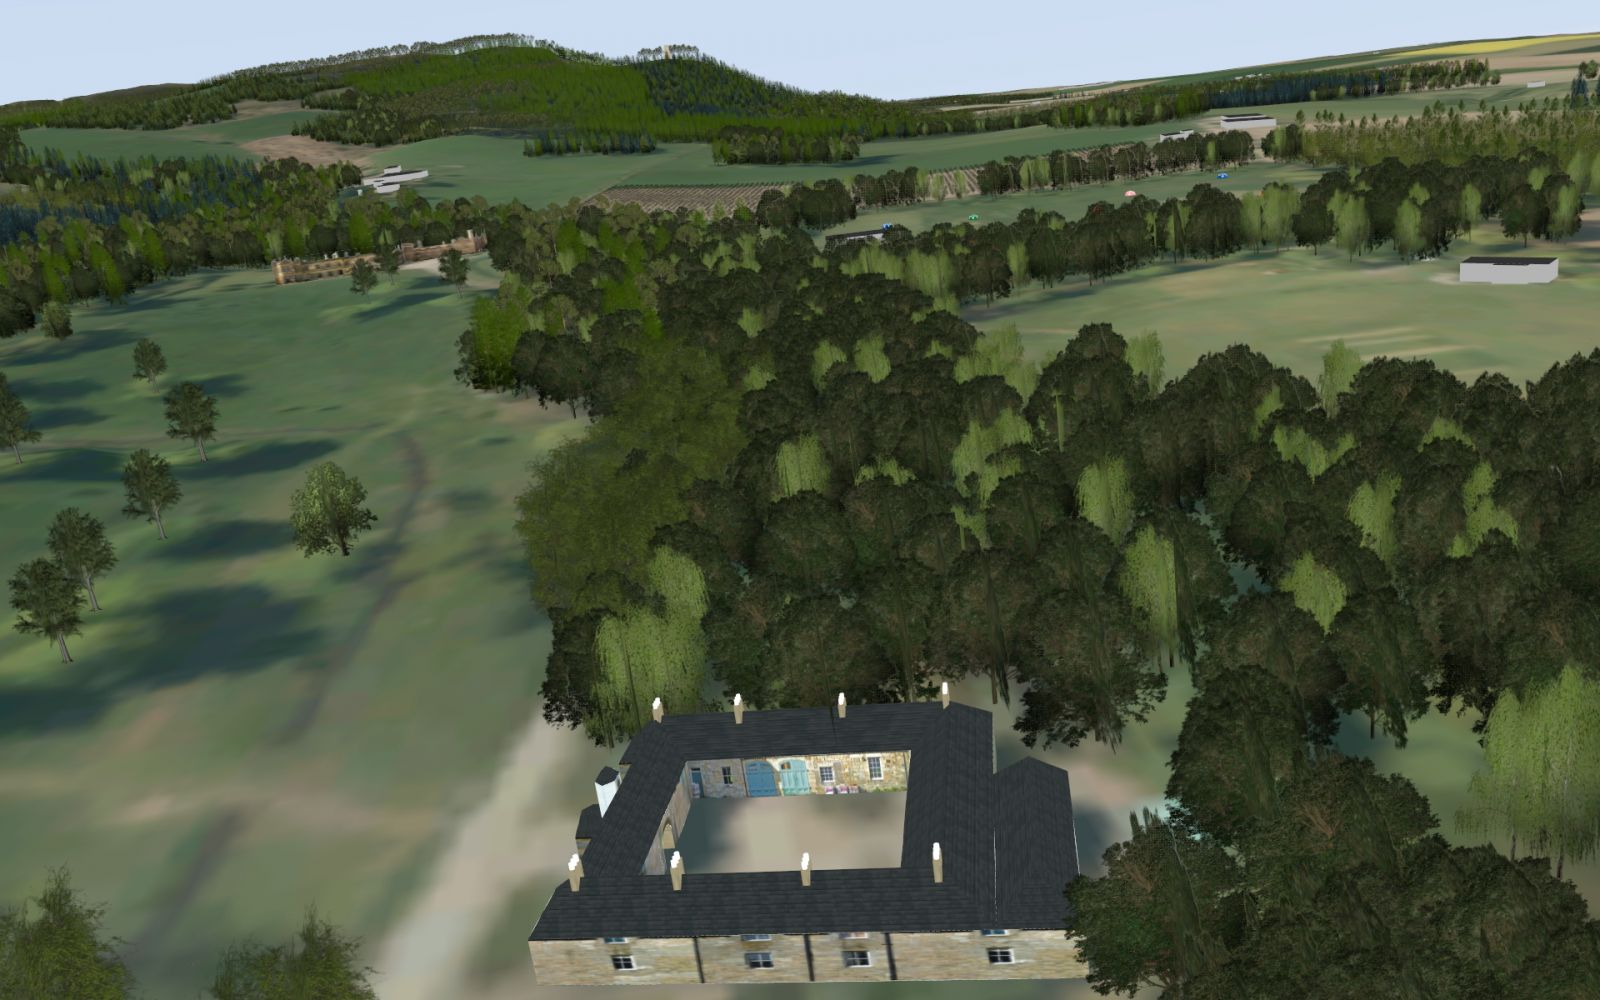
A 3D model of the Forest of Falkland, showing proposed changes to land use and infrastructure.
 [29] Green Health

Finlathen Park, Dundee. The model was prepared to provide a basis for use in a preference study, and interactive discussion with public and stakeholders. The still images reflect the key characteristics being identified in the ethnographic study (James Hutton Institute) and conjoint study from University of Edinburgh. The model was used at an event in the Finmill Centre, Dundee, for eliciting stakeholder perspectives on green spaces and the roles people’ perceived such spaces as playing in relation to their daily lives. Members of the audiences included Dundee City Councilors, planners, and members of the local community, across all ages. Feedback on the model and facility from the audience was very positive, and a number of recommendations made by people familiar with the area were incorporated into the project.
 [30] Visualising Urban Greening

A 3D model showing proposed urban greening and water feature at the Aberdeen treatment plant, Nigg.
 [31]Proposed urban greening in a low-income high-density housing settlement [32], South Africa.
Other Scientific Visualization
 [33]Visualization of Major Soils Sub-Groups [34] and Land cover Scotland 1988 [35] using Google Earth Liquid Galaxy in the VLT and on desk top. Google Earth based models allow for really large (Scotland sized!) models /data set which can run on an ordinary desktop.
Visualization of the Bowmont
 [36]Visualization of the Bowmont from data captured by an Unmanned Aerial Vehicle (UAV). Original DTM resolution was 6.2 cm, and the aerial image was 3.1 cm! Low-cost high-resolution data covering small areas is very useful in on-going research / visualization involving highly dynamic systems such as rivers.
Bibliography
<iframe src="https://www.google.com/maps/d/u/0/embed?mid=1M3mCh-u--KZUSgfW8dHedMHbHns [37]" width="640" height="480"></iframe>
Links:
[1] https://orcid.org/0000-0001-5859-5236
[2] https://www.hutton.ac.uk/sites/default/files/files/marine visualization flyer.pdf
[3] https://www.hutton.ac.uk/learning/exhibits/vlt
[4] http://www.hutton.ac.uk/staff/gillian-donaldson-selby/virtual-landscape-theatre-events-gillian-donaldson-selby
[5] https://www.hutton.ac.uk/sites/default/files/files/Occulus_Rift__smaller.jpg
[6] http://www.hutton.ac.uk/marine-and-seascape-visualization
[7] http://www.oculus.com/
[8] https://www.hutton.ac.uk/sites/default/files/images/TT.jpg
[9] https://www.hutton.ac.uk/sites/default/files/images/RHS.jpg
[10] https://www.hutton.ac.uk/sites/default/files/images/Wind_and_Tidal_Turbines.jpg
[11] https://www.hutton.ac.uk/sites/default/files/files/LL_6.gif
[12] https://www.hutton.ac.uk/sites/default/files/files/NW-SE_No_Ocean.jpg
[13] https://www.hutton.ac.uk/sites/default/files/files/Wind_andTidal_Turbines_Large.mp4
[14] http://www.hutton.ac.uk/sites/default/files/images/Loch_Linnhe_Planimetric.jpg
[15] https://www.hutton.ac.uk/sites/default/files/files/Visualising Coastal Environments.pdf
[16] http://www.obanseafestival.org/gallery-from-2012-festival/18-22-may-virtual-landscape-theatre
[17] https://www.hutton.ac.uk/sites/default/files/images/Tarland_Flood _NW-SE.jpg
[18] http://www.knowledgescotland.org/briefings.php?id=366
[19] https://www.hutton.ac.uk/sites/default/files/images/Pond.jpg
[20] https://www.hutton.ac.uk/sites/default/files/images/staff/Gillian_DS/ML_Combined.jpg
[21] https://www.hutton.ac.uk/sites/default/files/files/staff/donaldsonselby/Mar_Lodge_Browser.zip
[22] https://www.floodmodeller.com/en-gb/
[23] https://www.hutton.ac.uk/sites/default/files/files/staff/donaldsonselby/Mar_Lodge_Google_Earth.zip
[24] https://www.hutton.ac.uk/sites/default/files/files/Mar_Lodge_Google_Earth_model.pdf
[25] https://youtu.be/PUjPHiw0svI
[26] https://www.hutton.ac.uk/sites/default/files/images/Tarland_Composite.jpg
[27] http://surveys.hutton.ac.uk/index.php?sid=22947&lang=en
[28] https://www.hutton.ac.uk/sites/default/files/images/Falkland_Large_2.jpg
[29] https://www.hutton.ac.uk/sites/default/files/images/Dundee_Green.jpg
[30] http://www.hutton.ac.uk/sites/default/files/images/Urban_Greening.jpg
[31] http://www.hutton.ac.uk/sites/default/files/images/Urban_Greening_3.jpg
[32] http://www.sciencedirect.com/science/article/pii/S1618866706000793
[33] http://www.hutton.ac.uk/sites/default/files/images/MSSG_Soils.jpg
[34] https://www.hutton.ac.uk/sites/default/files/files/MSSG_Soils.zip
[35] https://www.hutton.ac.uk/sites/default/files/files/LCS88.zip
[36] http://www.hutton.ac.uk/sites/default/files/images/Bowmont_UAV.jpg
[37] https://www.google.com/maps/d/u/0/embed?mid=1M3mCh-u--KZUSgfW8dHedMHbHns