Land Capability for Agriculture (LCA)
Soil is a fundamental part of land and is key in determining what activities can be undertaken and supported on different types of land; how capable is land is sustaining different farming systems, different woodland types, valued habitats, as a sink for carbon.
The Institute has a long and successful record in capability assessment and mapping. The Land Capability for Agriculture classification was developed in the late 1970s and is as relevant now as it has ever been. It is now being used in both a research capacity in the assessment of climate change impacts on agriculture and in policy development as agricultural subsidy moves towards area-based payments.
The LCA classification is used to rank land on the basis of its potential productivity and cropping flexibility. This is determined by the extent to which the physical characteristics of the land (soil, climate and relief) impose long term restrictions on its use.
The LCA is a seven class system. Four of the classes are further subdivided into divisions. Class 1 represents land that has the highest potential flexibility of use whereas Class 7 land is of very limited agricultural value.
You can download the spatial data digitised from the Land Capability maps from here.
The Map Series
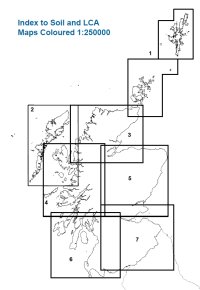
Two series of Land Capability for Agriculture (LCA) maps (now available on Scotland’s Soils website in digital format) have been produced.
Firstly a national coverage of seven maps at the 1:250 000 scale was published in 1983 but with the assessment carried out in 1981. Secondly there is a more restricted coverage of 30 1:50 000 scale maps covering virtually all of the Scotland’s improved agricultural land and adjacent uplands, published at various dates between 1984 and 1986.
Both map series have subsequently been digitised; the 1:250 000 scale data in the late 1980s and the 1:50 000 scale in the early 2000s and are available to download as Esri shapefiles elsewhere on this site. A statistical summary of the distribution of the various classes in Scotland’s 32 local authorities is available here.
Issues arising
This difference in resolution has resulted in a number of issues which are not unique to LCA maps and data but are ubiquitous when dealing with maps of different scales.
- The 1:50 000 scale maps are more detailed and were compiled more recently. They involved more field checking and liaison with government and with research and agricultural organisations such as the Scottish Agricultural Colleges and the National Farmers Union of Scotland in comparison to the 1:250 000 maps. The work to produce the 1:250 000 maps was largely desk based and built on the 1:250 000 soils mapping.
- The two maps (and associated digital data) do not necessarily show the same classification in the same area. By necessity, the smaller scale 1:250 000 scale map often represents an aggregation of different classes represented on the larger scale map, which can include land of both higher and lower quality than that depicted. The larger scale allows more disaggregation of the landscape into its component units and can show a more complex pattern of map units.
- The two map scales do not match along the edge at which they meet. This is largely a function of the fact that more detail can be represented at the 1:50 000 scale than at 1:250 000 scale, but also reflects the different level of on site assessment and checking.
- New information was collected between the different map production dates which led to a reclassification of some soils.
- The maps have been digitised from the paper copies, so in that respect the hard copy maps are the definitive assessments; minor digitising errors may still reside within the digital data. In addition, the hard copy maps display LCA class, division and limitation type; the digital data does not include limitation type.

Recommendation
Where it exists (predominantly in the agricultural lowlands of the south and east of the country) the 1:50,000 scale map information is seen as the definitive mapped assessment and the 1:50 000 scale map should be used in preference to the 1:250 000 scale map. For a more site-specific query or to resolve a planning issue, we recommend that a further and very detailed site inspection is carried out.