Research themes
At The James Hutton Institute, our research themes are committed to advancing scientific knowledge and innovation to address pressing global challenges.
Our research themes encompass a diverse range of disciplines, from land and crop sciences to water, the environment and socio-economic research. With a strong focus on interdisciplinary collaboration, we work in partnership with people, organisations and governments to provide practical solutions that support sustainable resource management. Our overarching vision is to be at the forefront of transformative science, ensuring the well-being of communities and the responsible stewardship of our natural resources.
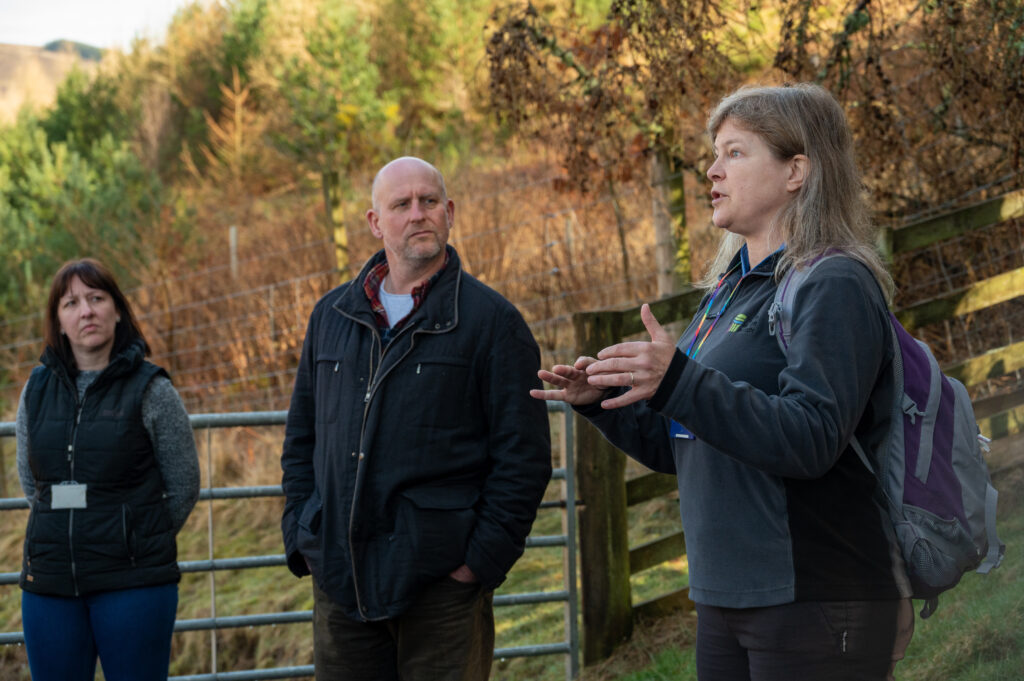
Connecting land and people
Supporting sustainable and resilient communities through social, economic and technical innovations.
Through understanding the interactions between production systems, the environment and people, we are developing tools and capabilities that support circular economies.
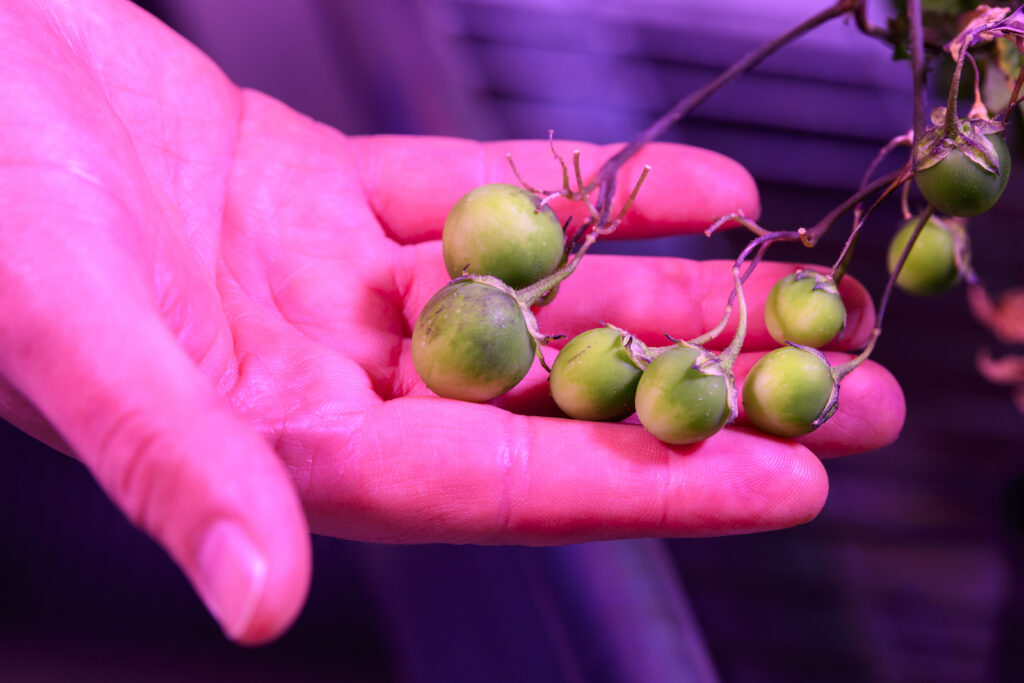
Improving crop resilience and sustainability
Developing crops and cropping systems that deliver food and plant products for economic prosperity and wellbeing while safeguarding the environment.
Due to climate change, pests and diseases, and certain agricultural practices, the long-term resilience and sustainability of many crops are under threat.
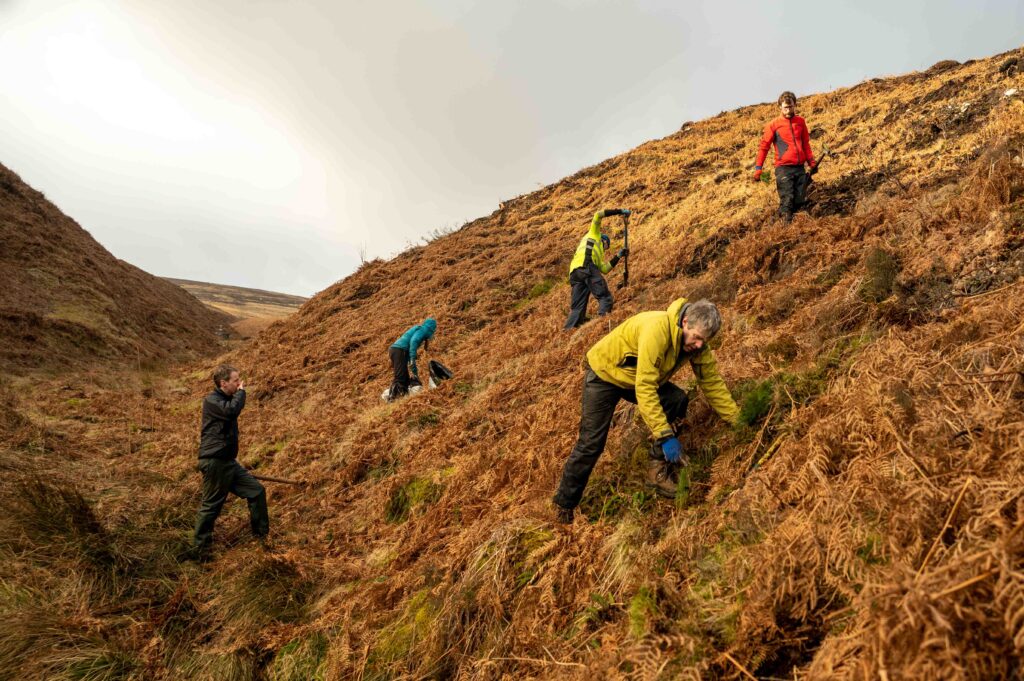
Protecting and enhancing natural capital
Increasing the resilience of ecosystems for multiple benefits.
Natural capital is what we call our land, soil, water, animals and plants. All of these elements together form eco-systems that support how we live and what we can grow. The climate and nature crises, together with certain types of human practices, have resulted in damage to our natural capital and ecosystems.
Stay connected with The James Hutton Institute research
You can stay connected with our science by following us on social media, our profiles are your gateway to the latest scientific breakthroughs, insights from our experts, and a closer look at how we’re addressing the world’s most pressing environmental and sustainability challenges. By following us, you’ll get real-time updates on our projects, events, and collaborations. Follow us on X, LinkedIn and Facebook now.