Research projects
The James Hutton Institute’s research projects drive agricultural innovation, environmental sustainability, and biodiversity conservation, shaping solutions for a changing world.
Our interdisciplinary research spans crop resilience, soil health, land use studies, and climate change adaptation, ensuring a sustainable future for both rural and urban landscapes.
Through collaborative studies and data-driven research, we explore ecosystem services, sustainable agriculture, and natural capital enhancement, delivering impactful findings that inform policy and support community engagement. Discover how our scientific investigations contribute to global sustainability goals and advance resource management for generations to come.
Find out more about The James Hutton Institute’s pioneering research below:
-
Triggering environmental transformation on large land holdings
About the Project This project used an established conceptual framework for understanding transformational change in agriculture (the ‘Triggering Change Model’),
-
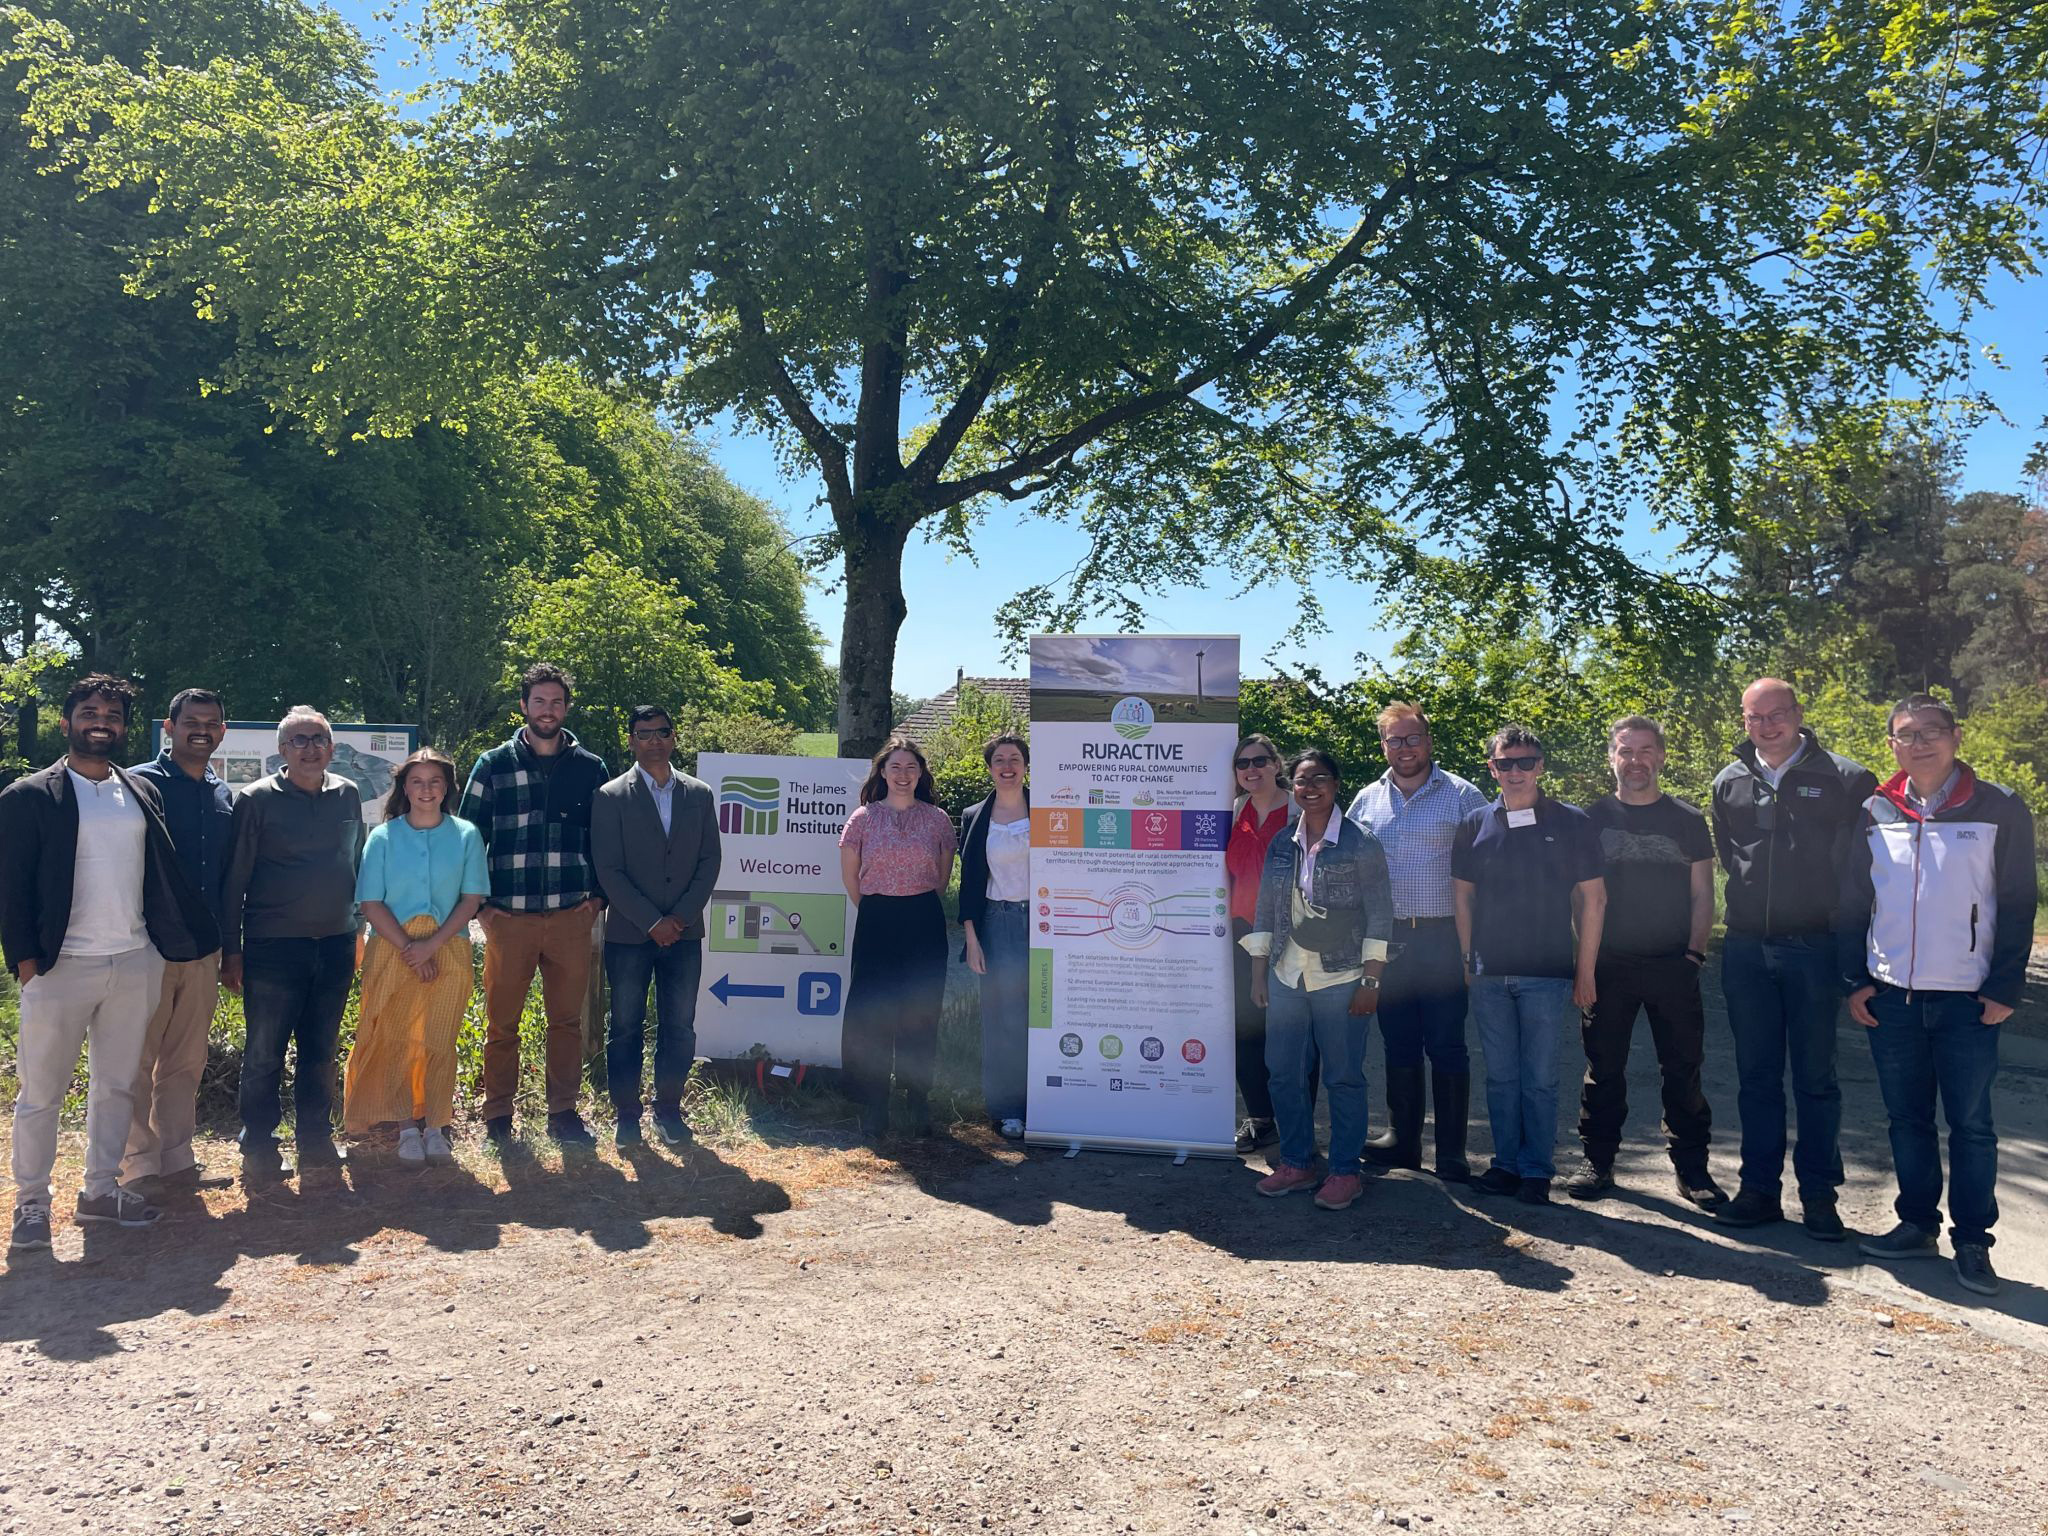
RURACTIVE
RURACTIVE aims to promote equitable and sustainable change in rural areas by developing and testing smart, community-led, tailor-made, place-based and inclusive solutions within local “Multi-Actor Rural Innovation Ecosystems”
-
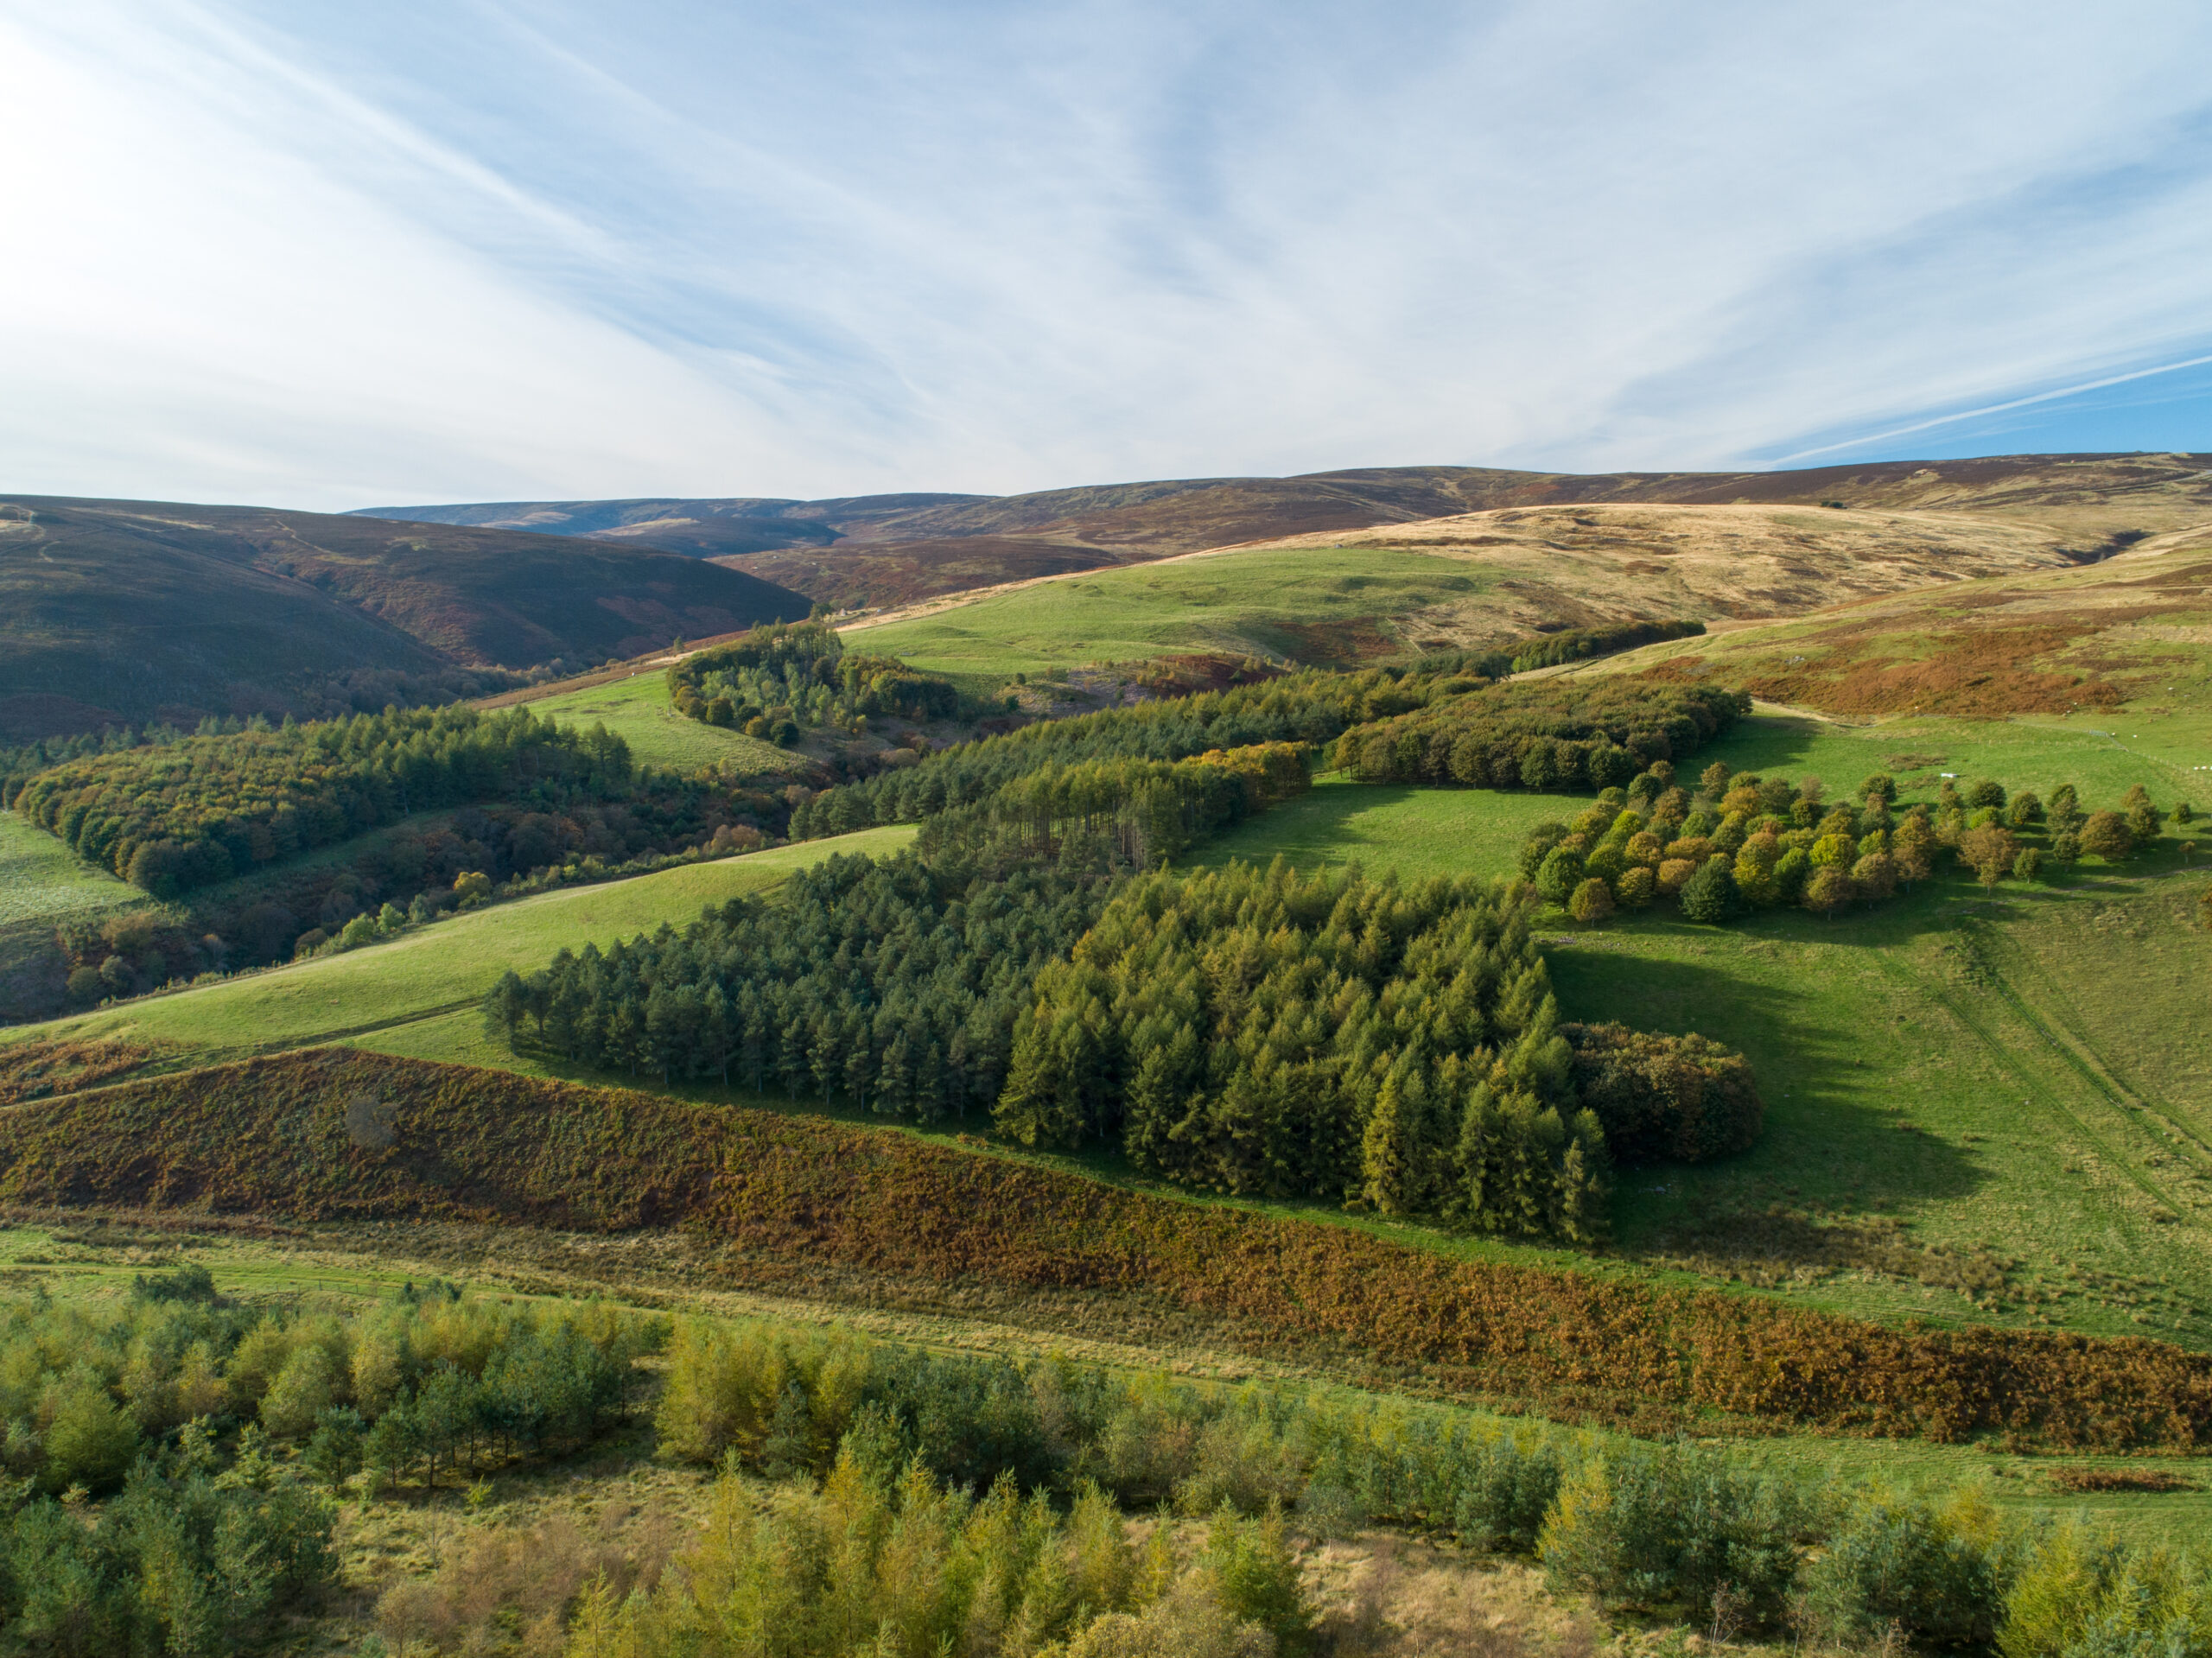
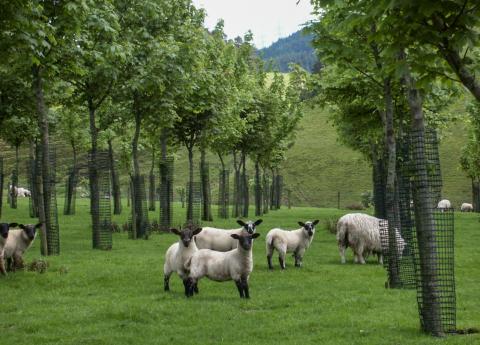
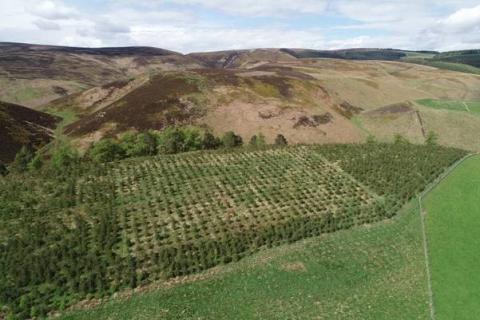
Agroforestry at Glensaugh
Agroforestry is a land management system which combines livestock grazing and forestry – the old experimental system at Glensaugh has been in place since 1988; and the new one since 2023.
-
FARM TREE – integrating trees on agricultural land
FARM TREE: balancing farm and landscape-scale demands for integrating trees on agricultural landFARM TREE is funded by the UKRI Future of UK
-

Does habitat restoration mitigate the impacts of nitrogen deposition?
We are assessing whether blanket bog restoration can aid in protecting or enhancing recovery from the impacts of nitrogen deposition.
-
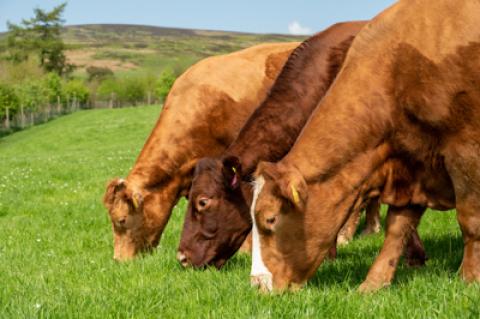
Improving pasture diversity for enhanced productivity, quality and resilience
This research is investigating how innovative grassland management, combining plant species diversification with rotational grazing, can reduce GHG emissions and produce multiple benefits for livestock, biodiversity and climate resilience.
-
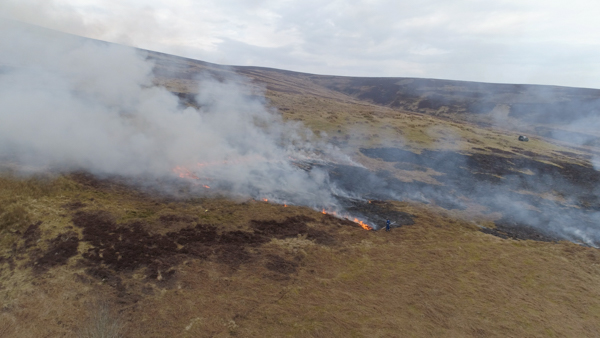
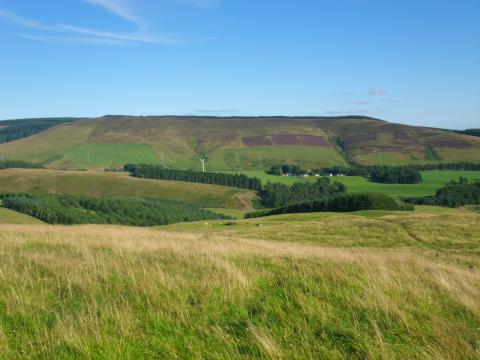
Managing heather moorlands: burning and cutting
This research compares the impacts of heather moorland managed by muirburn versus by brushcutting. This trial has focussed on studying early changes in carbon stocks, plant litter decomposition and soil nutrient availability.
-
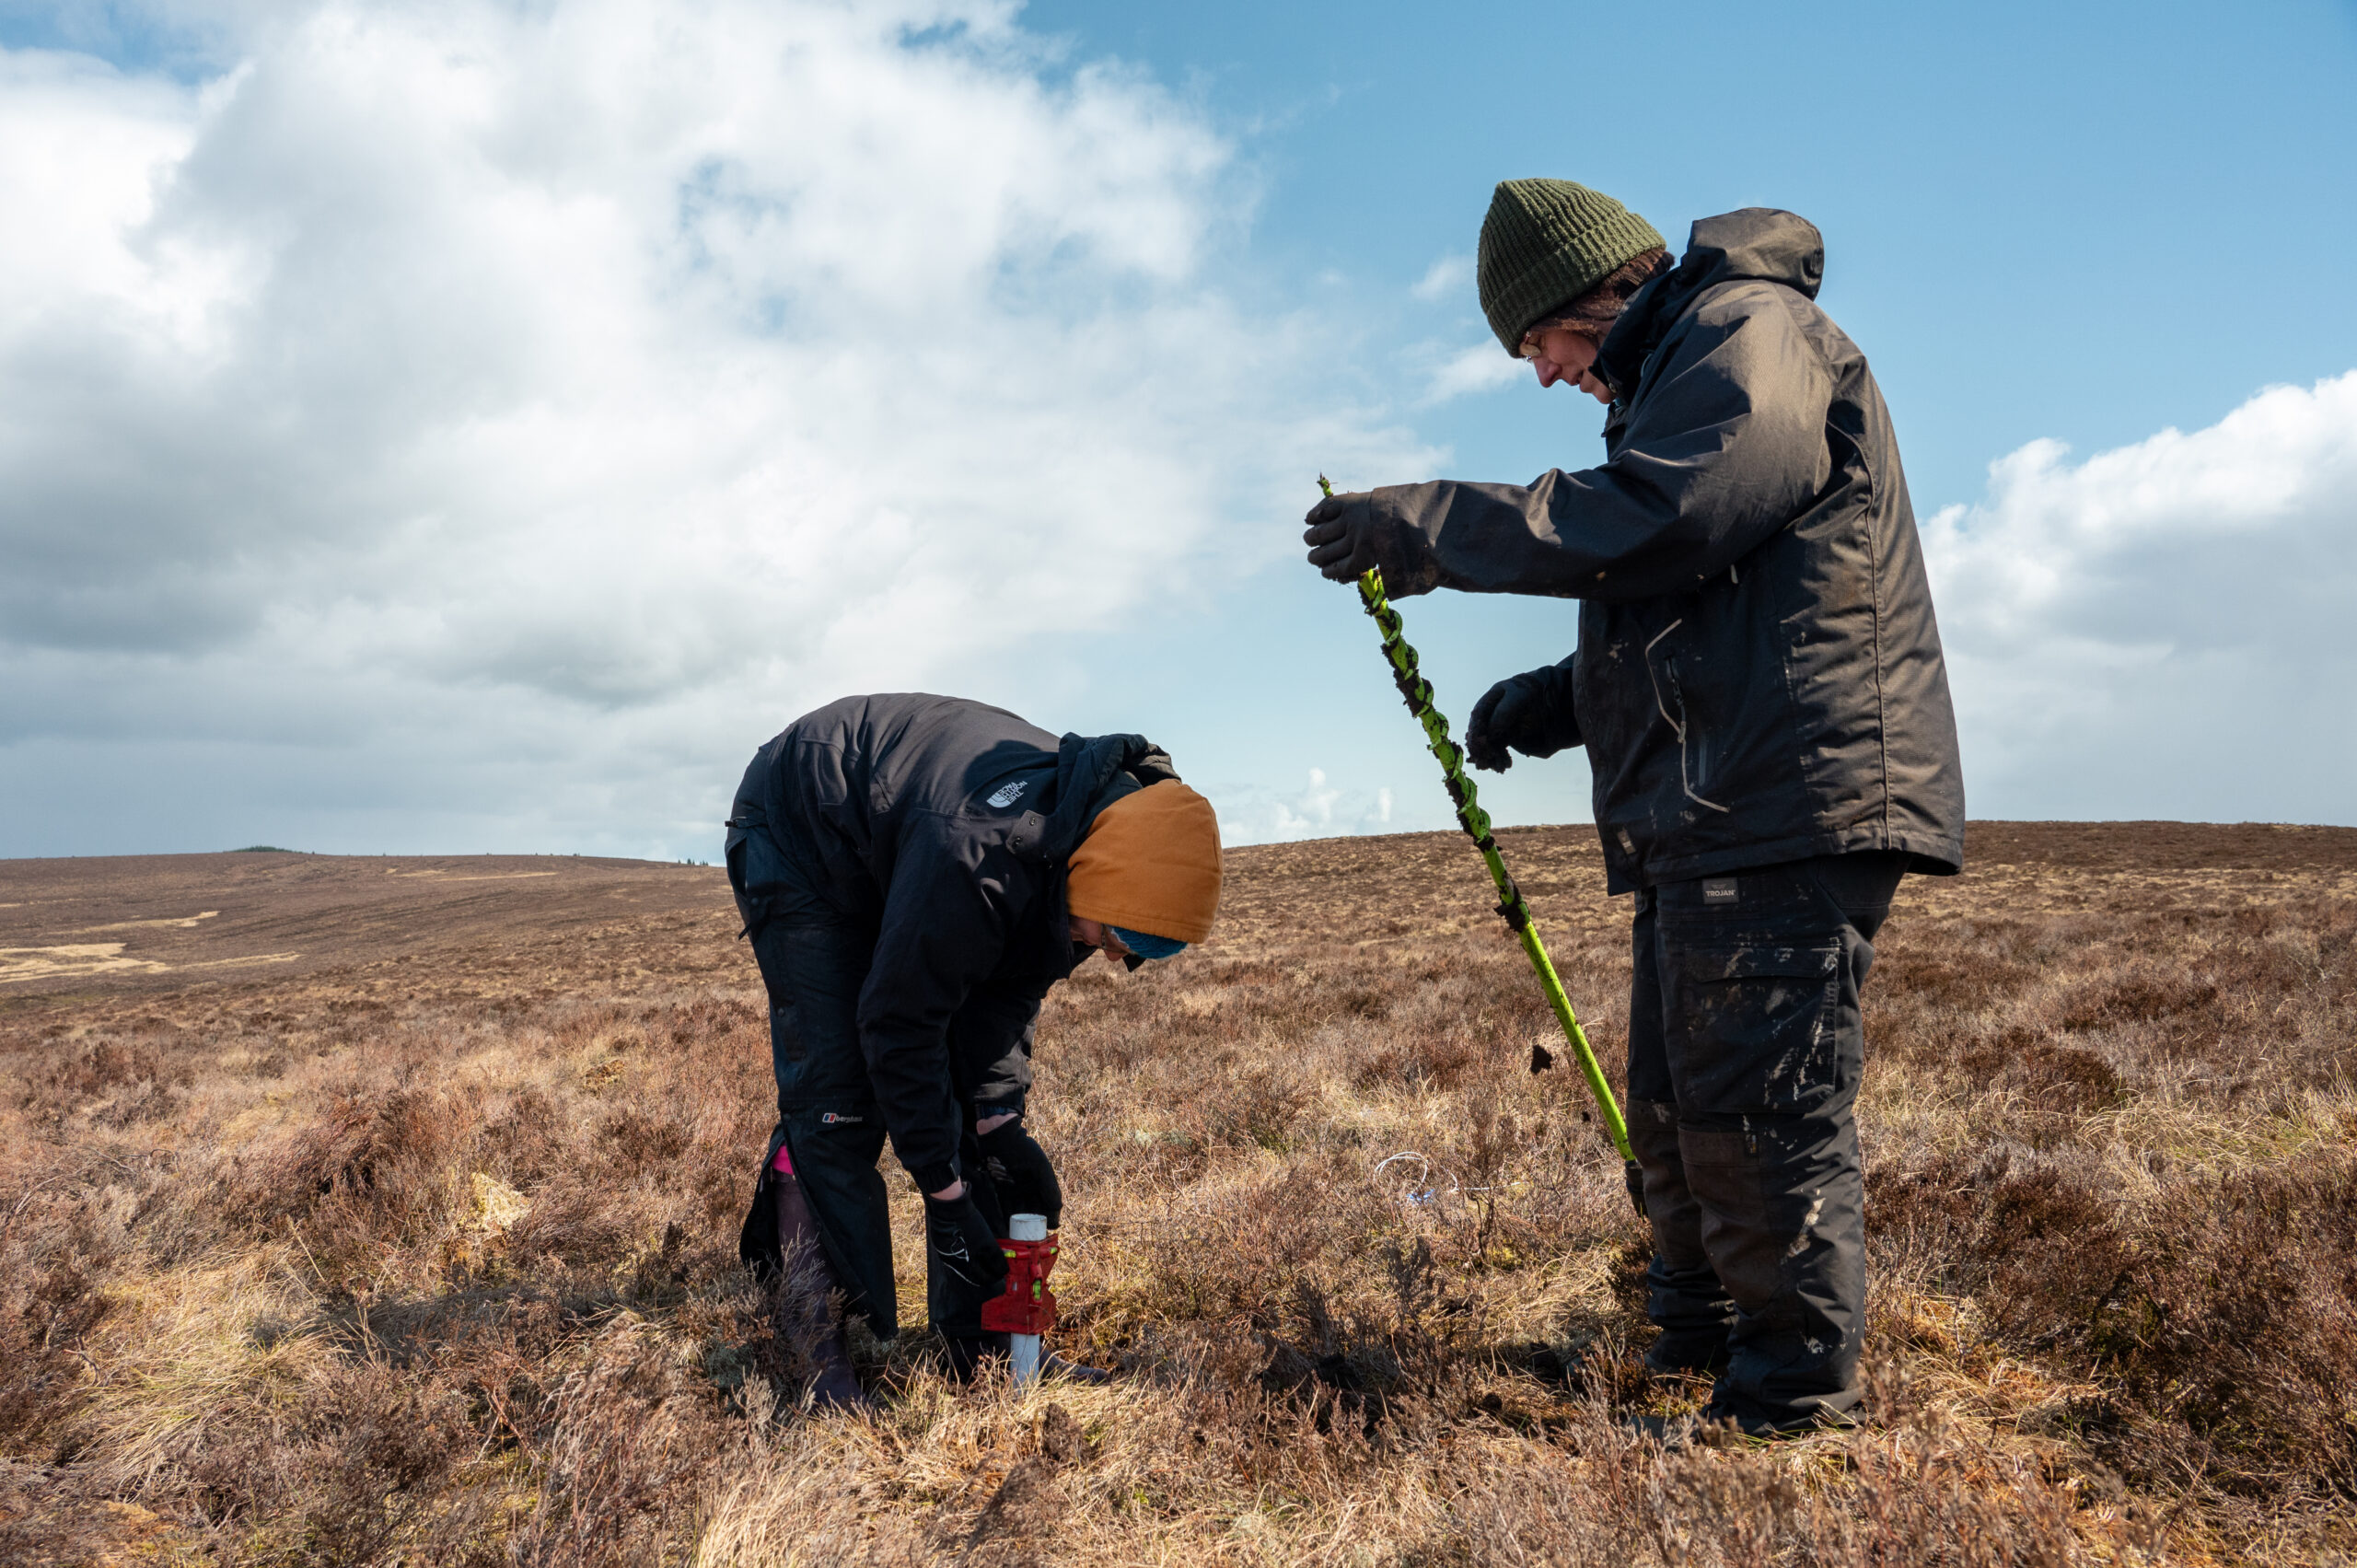
Peatland restoration hydrology and carbon monitoring
This project aims to better quantify the impacts of upland peatland / blanket bog restoration on carbon and water dynamics. We are measuring water table levels, and the quality and quantity of carbon dissolved and eroded in streams and gullies in both degraded and restored areas of the bog.
-
Pine provenance and climate change
This long-term experiment is tracking how pine trees grown from seed from Caledionan pinewoods across Scotland respond to climate change, pests and diseases.
-
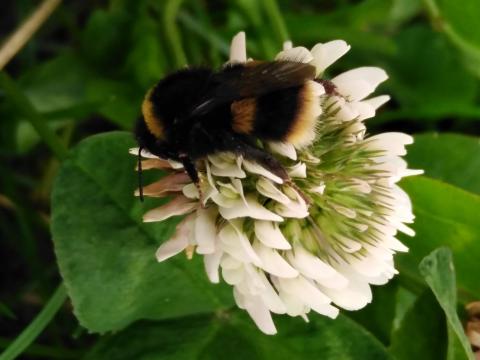
Sward diversification, biodiversity and forage quality
This experiment is investigating whether increasing the number of plant species in grazed grasslands can help other biodiversity and increase the quality of the forage.
-
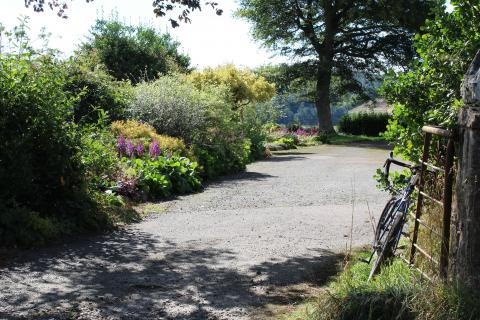
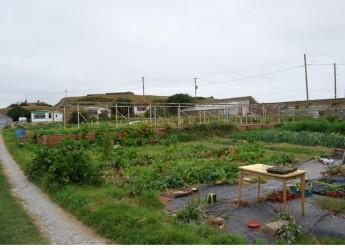
VisitGlensaugh
VisitGlensaugh is a scoping study which aimed to accumulate understanding of what the farm has to offer consumers, tourists and other visitors by building on the Glensaugh ‘story’, past, present and future.
-
Application of the Natural Capital Protocol in Glensaugh farm
The Natural Capital Protocol (The “Protocol”) has been applied to Glensaugh farm to evaluate the impacts and dependencies of past, actual, and potential changes in Glensaugh farm management strategies through a natural capital lens.
-
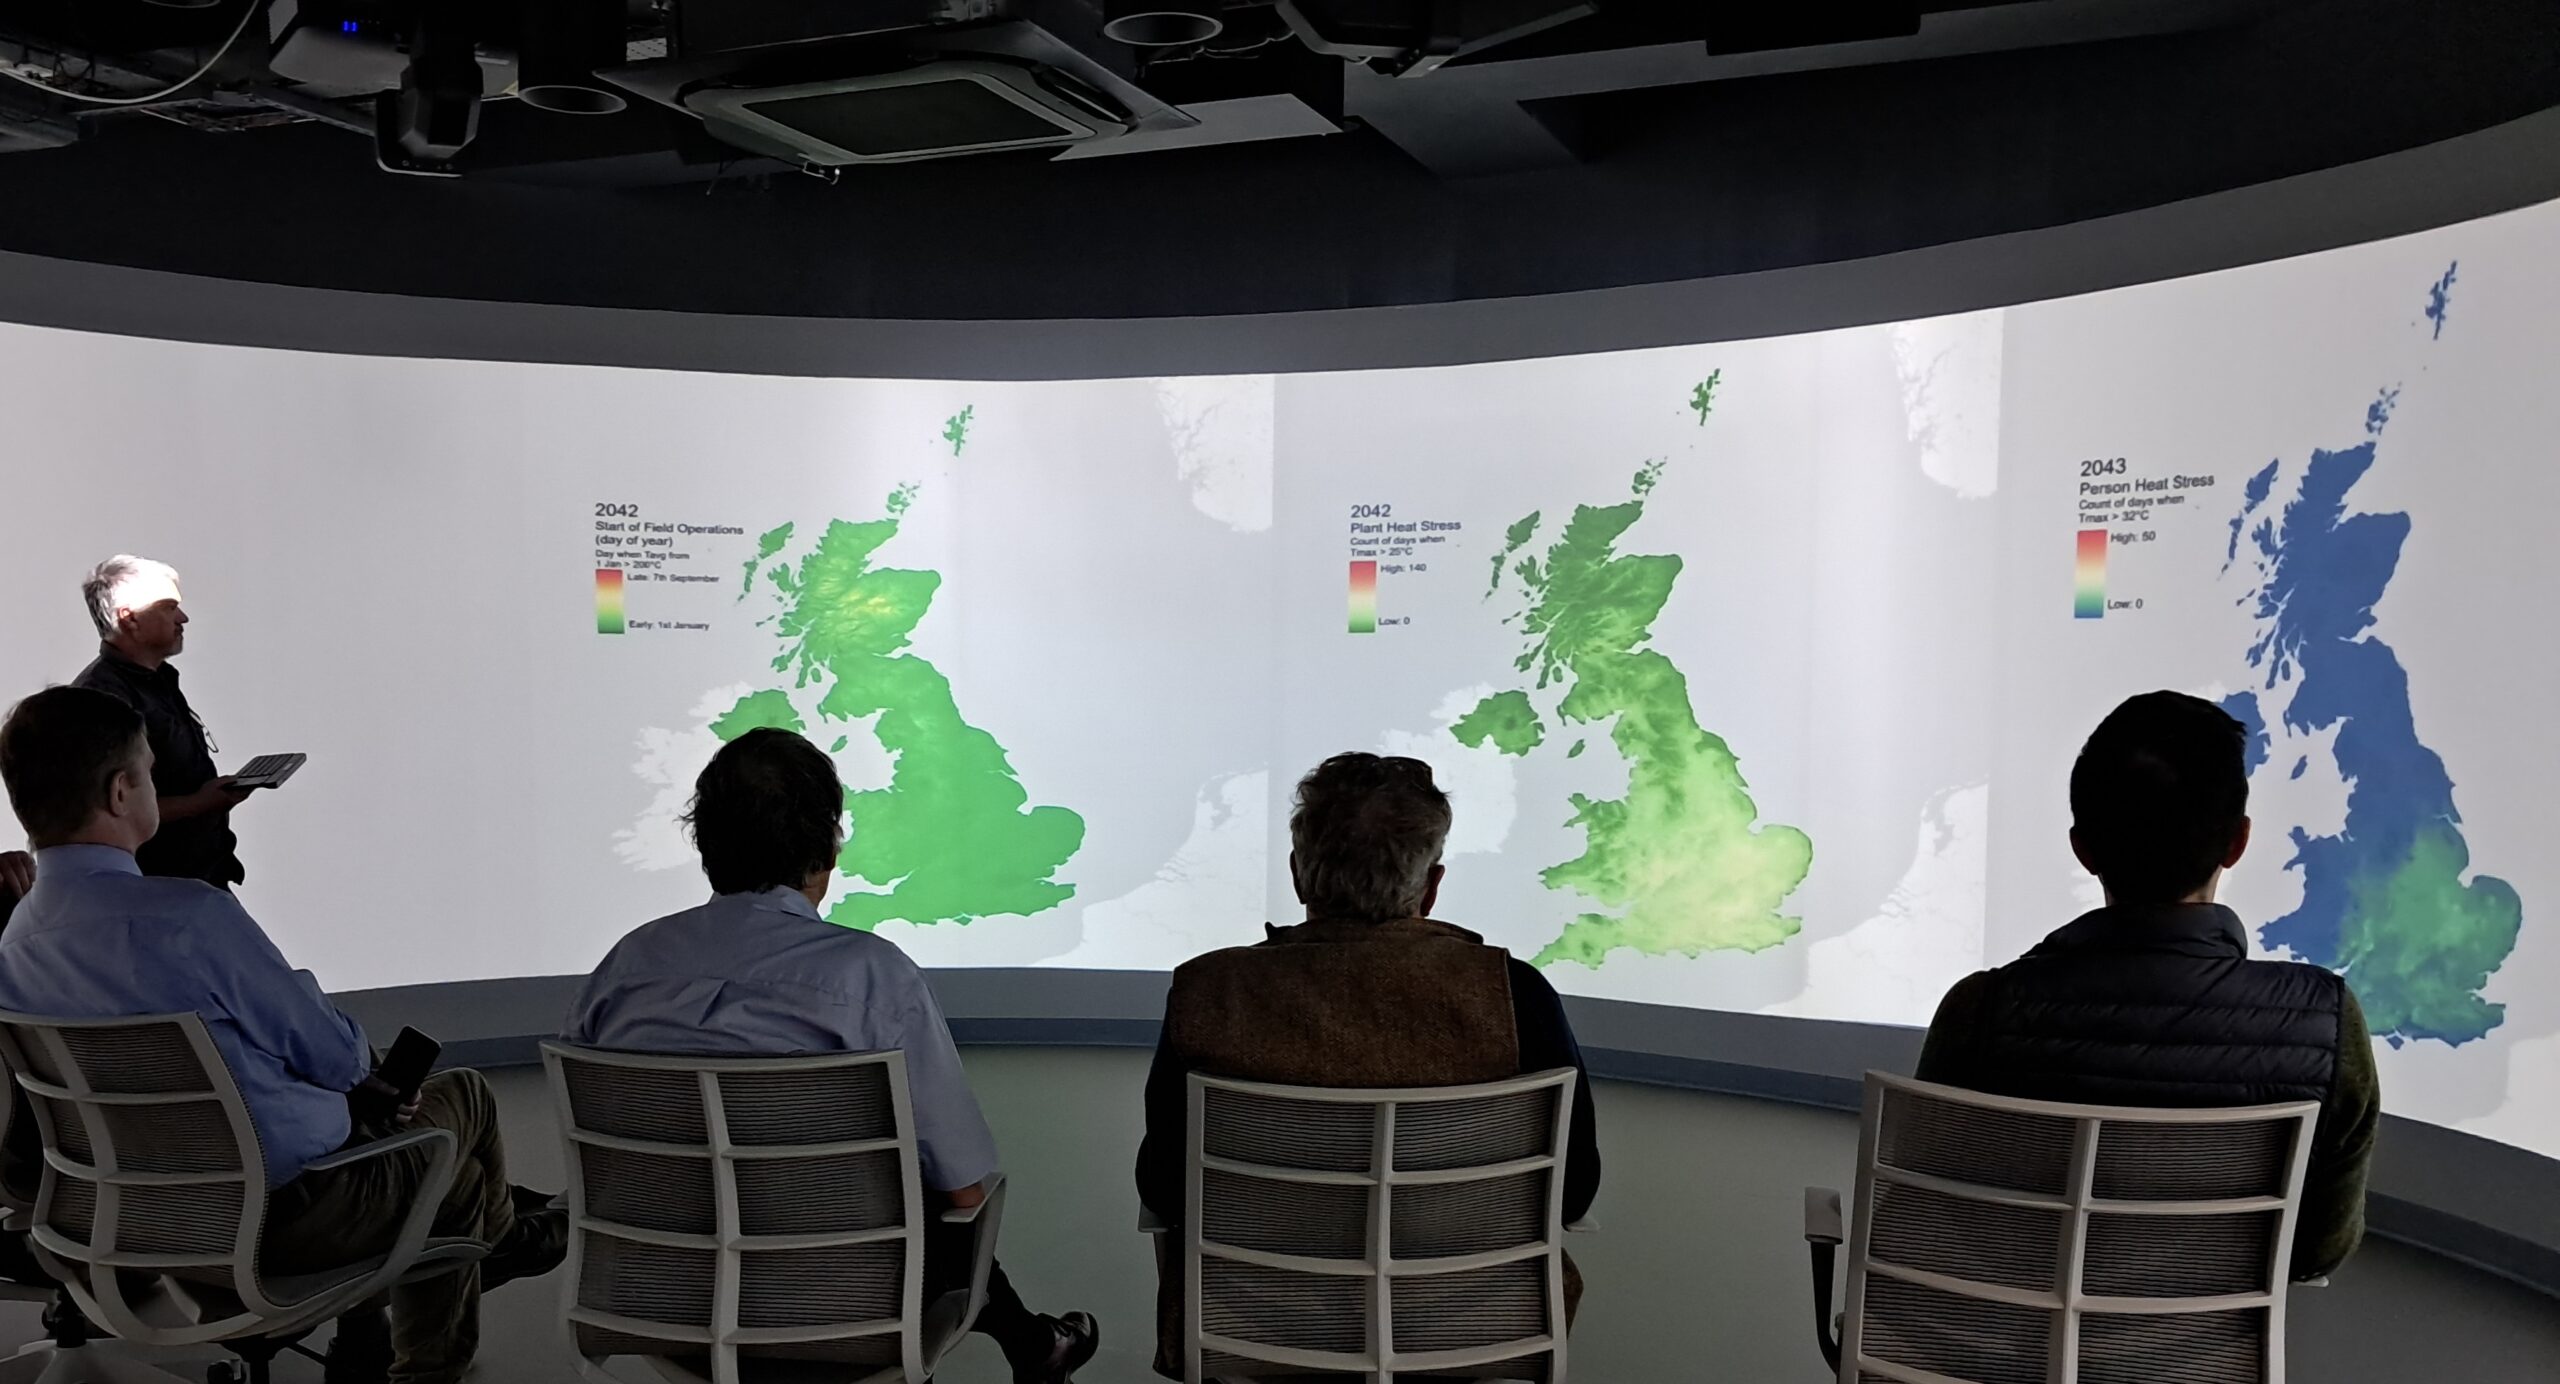
Land Use for Net Zero, Nature and People (LUNZ) Hub
The Land Use for Net Zero, Nature and People (LUNZ) Hub is an innovative research initiative that will help drive the transformation of UK land use needed to achieve net zero by 2050.
-
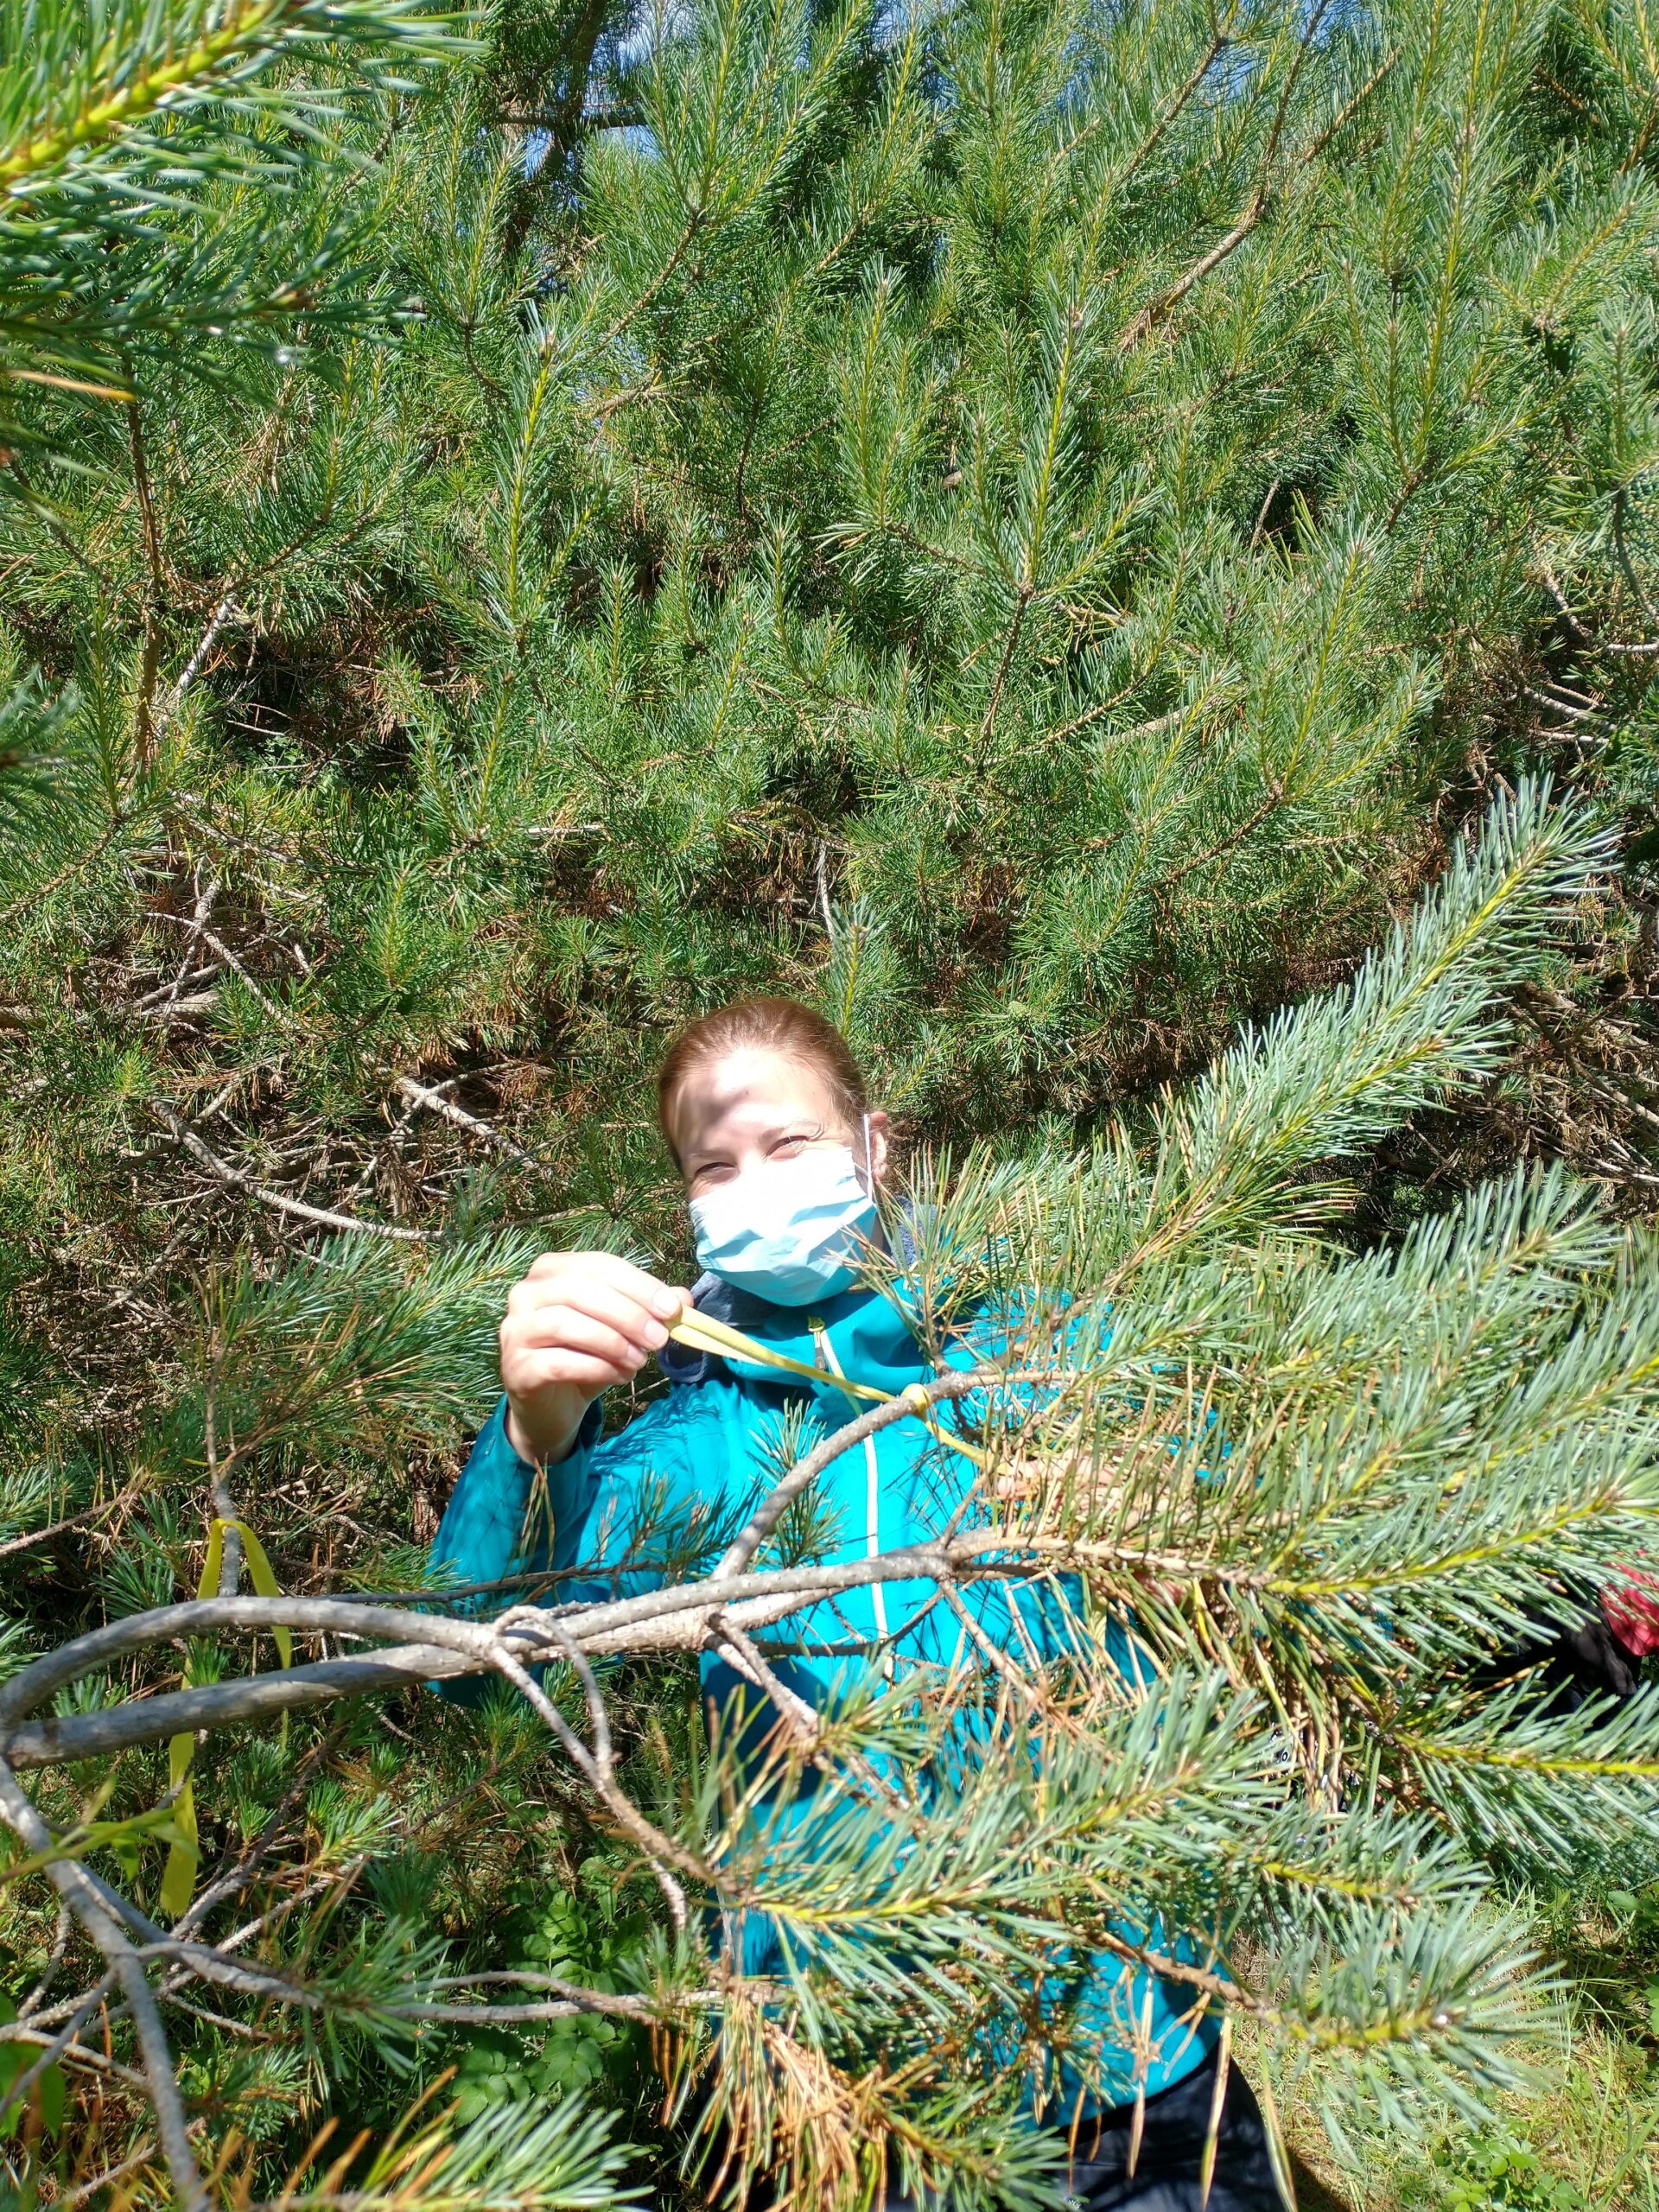
PineBiome
PineBiome is a collaborative project that aims to quantify how host genotype and microbiome composition combine to influence susceptibility to Dothistroma needle blight disease in pine trees.
-
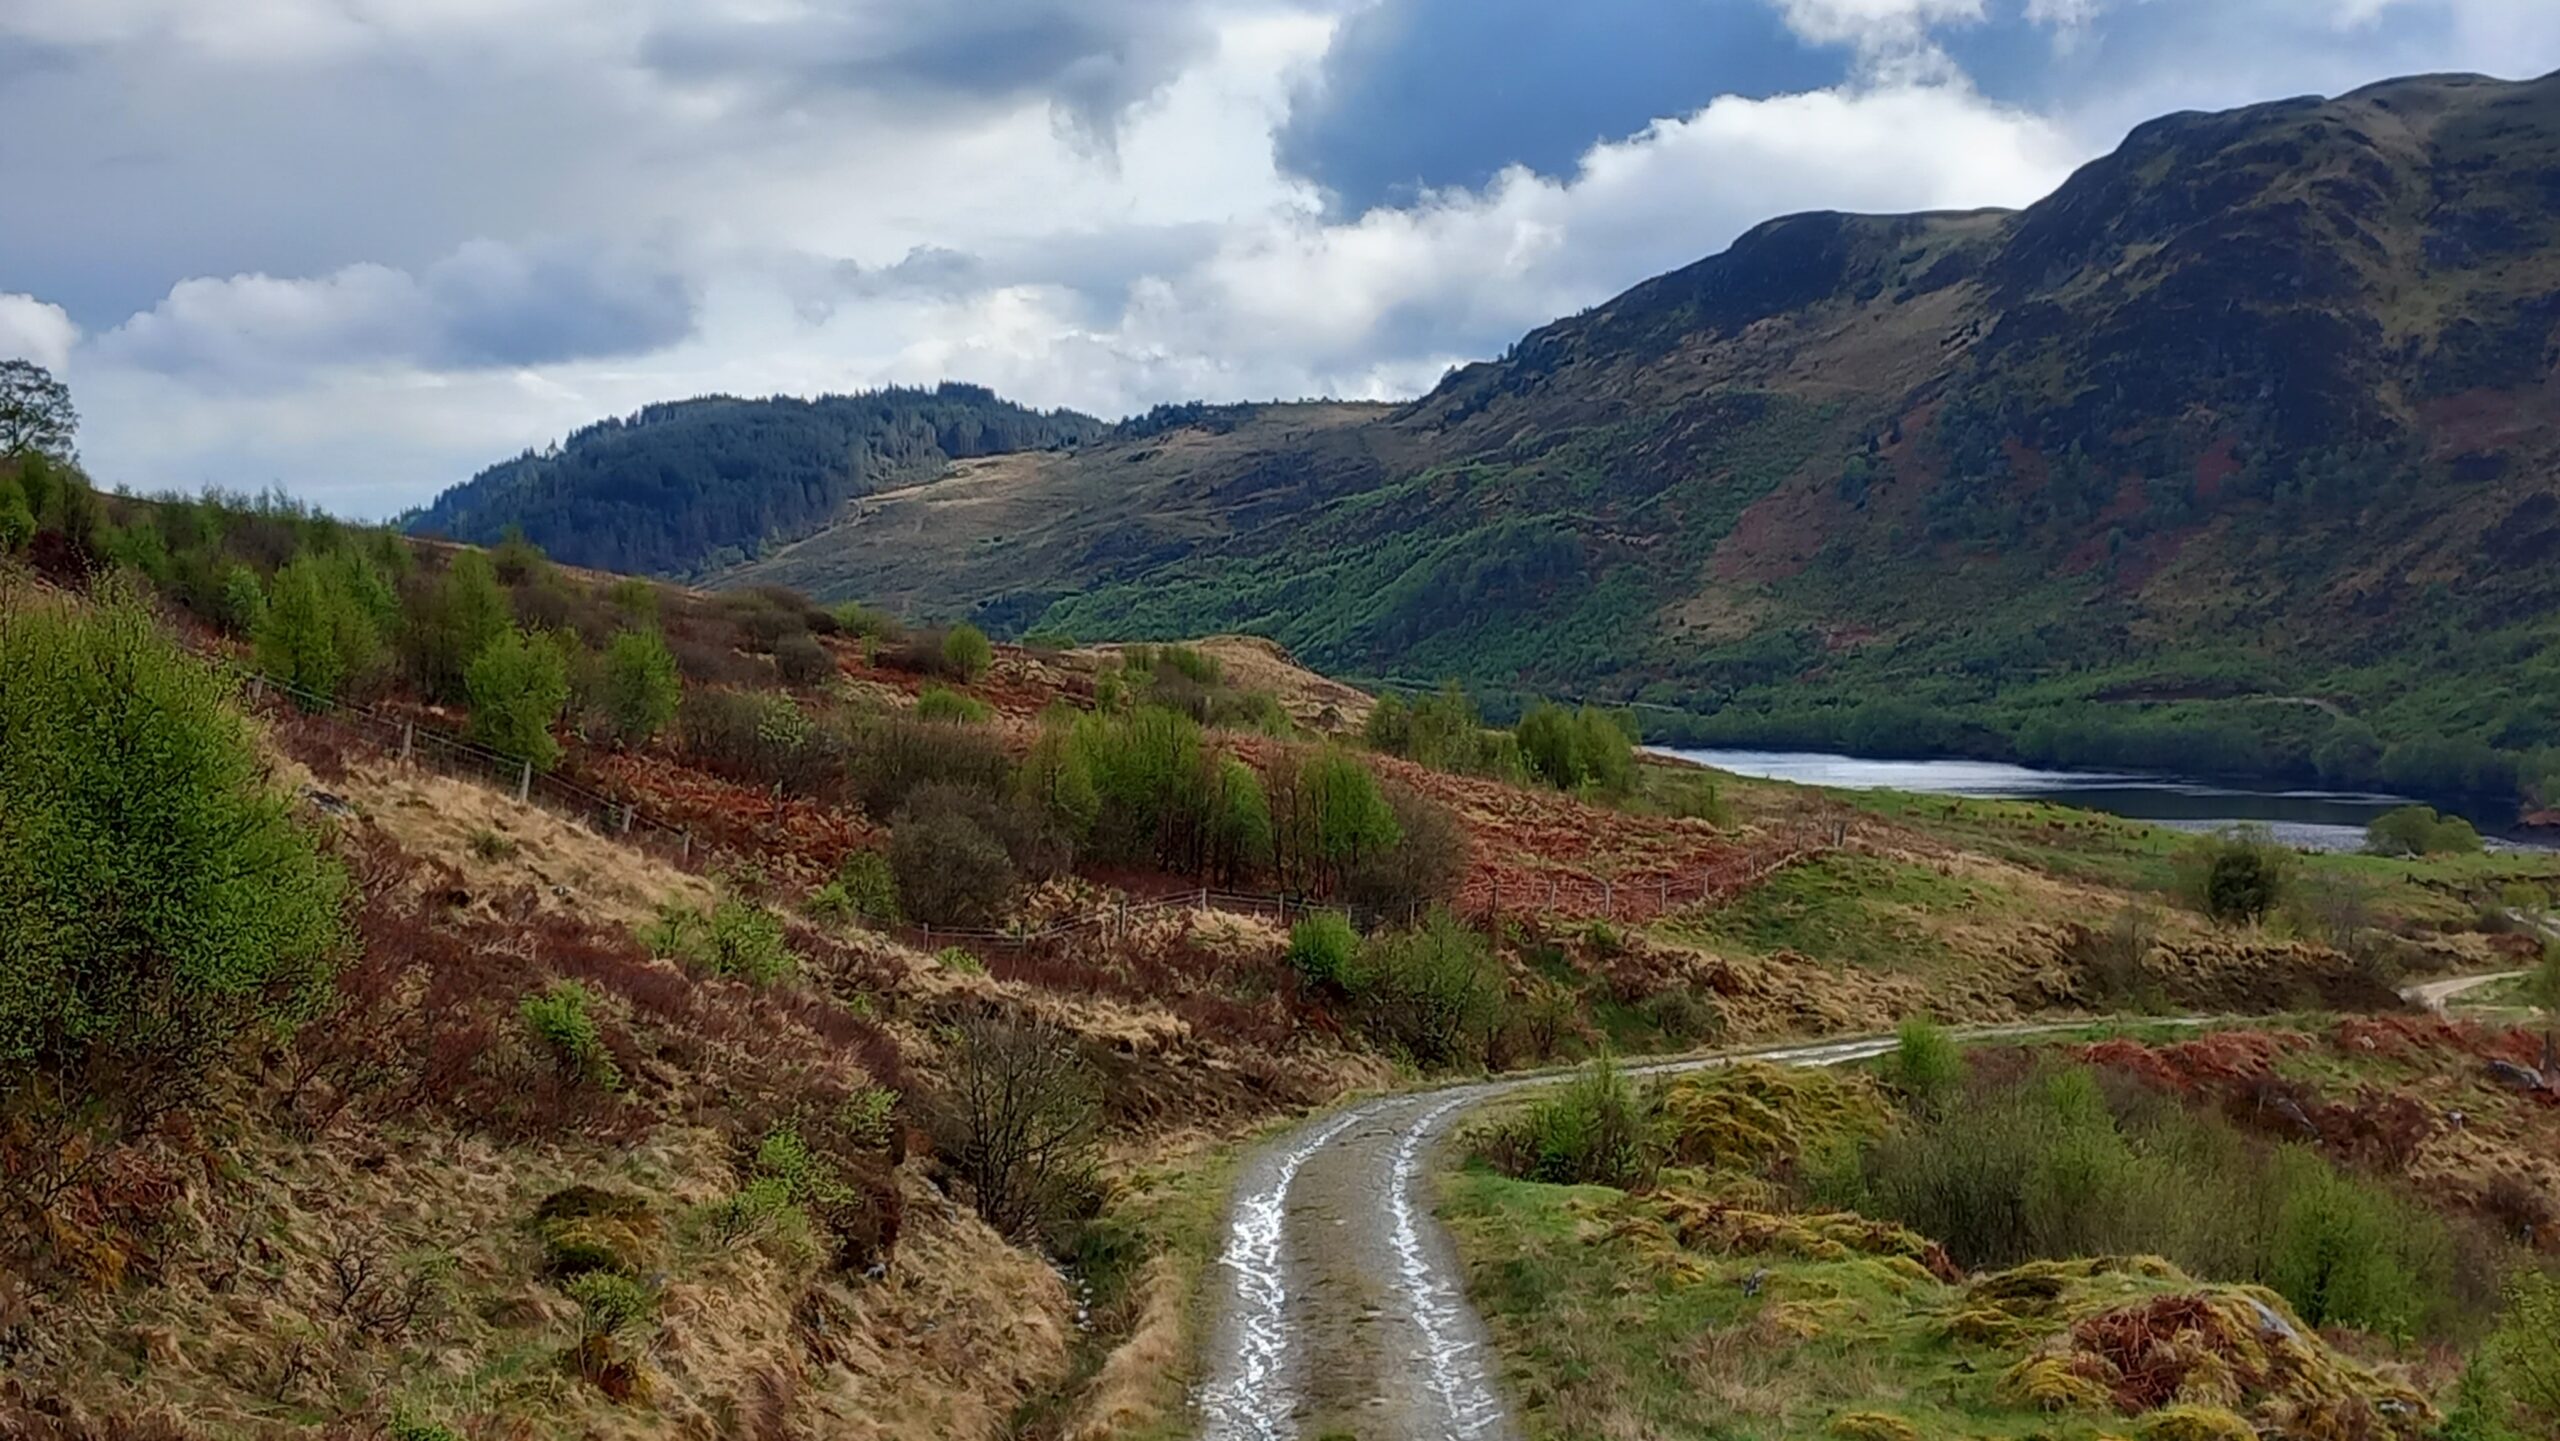
Glen Finglas grazing
The character of the Scottish upland landscape is shaped by domestic livestock grazing. The James Hutton Institute and collaborators have been conducting a grazing experiment at the Woodland Trust’s Glen Finglas estate, in the southern Highlands, since 2002.
-
CODECS
CODECS aims to support farmers and growers across Europe to improve their understanding of the social, economic and environmental benefits and costs of digital tools.
Stay connected with our science
You can stay connected with our science by following us on social media, our profiles are your gateway to the latest scientific breakthroughs, insights from our experts, and a closer look at how we’re addressing the world’s most pressing environmental and sustainability challenges. By following us, you’ll get real-time updates on our projects, events, and collaborations. Follow us on X, LinkedIn and Facebook now.