Information Visualisation and Information Systems
Making complex scientific data accessible, interpretable and impactful
We transform complex datasets into clear, meaningful visual representations that support understanding and decision-making. Through advanced information systems and visualisation tools, we enable researchers and organisations to explore, interpret and communicate large-scale scientific data effectively.
Driving innovation – unlocking big data with cutting-edge bioinformatics solutions
Modern biology is generating and increasing amount of data from heterogenous data sources which is often difficult to collect, store, visualise and analyse. Solutions are therefore needed to aid this process.
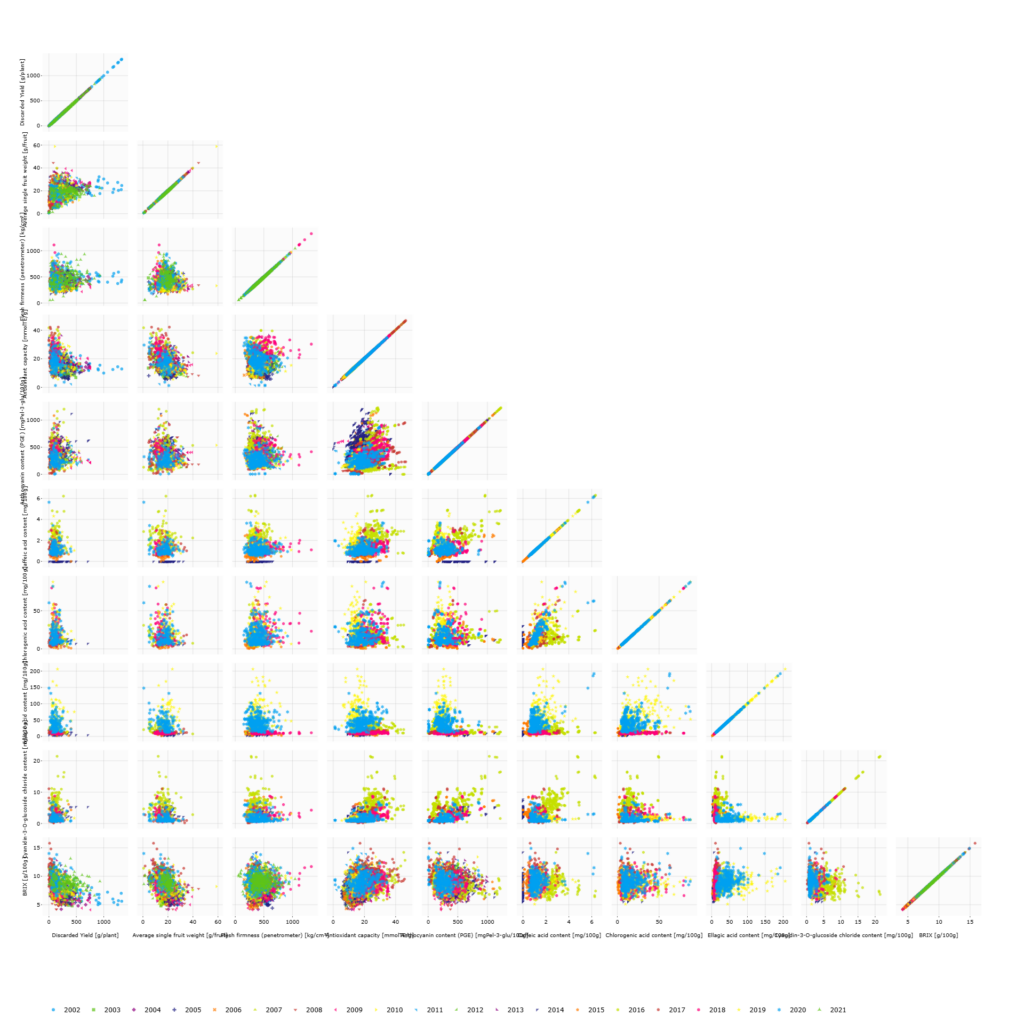
One of the main benefits of information visualization is its ability to reveal patterns and trends that might be hidden within raw data. By visually representing data, researchers can quickly identify correlations, outliers and anomalies that would normally be difficult to detect. This can lead to new insights and discoveries and help researchers gain a deeper understanding of their data.
Visualization also contributes towards the effective communication of scientific findings and results. Visual representations, such as charts, graphs and maps convey complex information more clearly and concisely than written descriptions thus increasing understanding This is particularly important when communicating with non-specialists, policymakers and the general public.
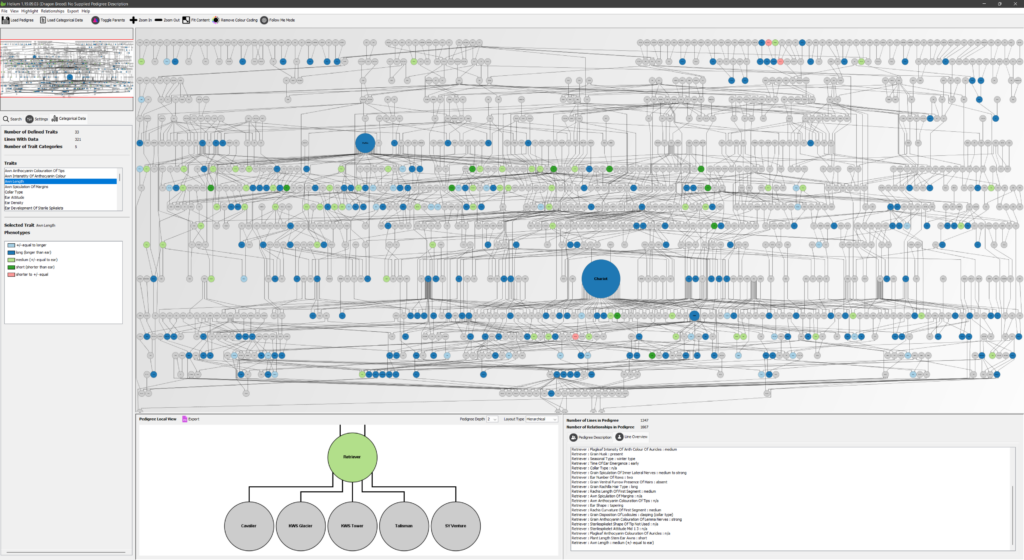
We have a demonstratable track history in the development of complex information systems covering tools relating to plant breeding, pre-breeding, genetics and ecological sciences and work on a number large international projects developing widely used visualisation tools.
We have a demonstratable track history in the development of complex information systems covering tools relating to plant breeding, pre-breeding, genetics and ecological sciences and work on a number large international projects developing widely used visualization tools.
Paul Shaw, Bioinformatician ICS

Information visualisation involves presenting complex data in visual formats such as charts, maps and interactive dashboards. Collaborations involving James Hutton Institute Scientific Services help transform large scientific datasets into clear visual insights.
Data visualisation helps scientists, policymakers and industry partners understand complex datasets more easily. By presenting information visually, researchers can communicate results more effectively and support evidence-based decision-making.
Information systems can include databases, digital platforms and analytical tools designed to store, manage and interpret large volumes of scientific data. These systems support collaborative research and knowledge sharing.